STrenD: Subspace Trend Discovery
From FarsightWiki
(Difference between revisions)
| Line 9: | Line 9: | ||
== Output files == | == Output files == | ||
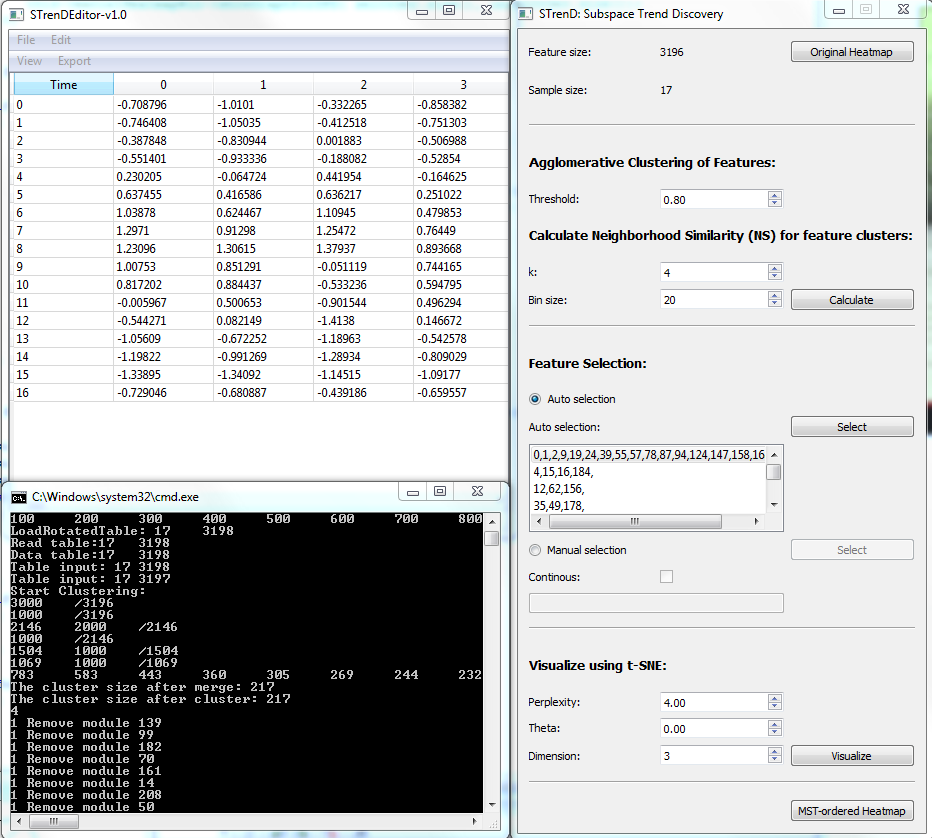
For 17 samples of 3196 dimensions, clustering sigma = 0.8, k = 4: | For 17 samples of 3196 dimensions, clustering sigma = 0.8, k = 4: | ||
| + | |||
1. 3196_17_0.8_clustering.txt: agglomerative clustering result, containing index and feature names; | 1. 3196_17_0.8_clustering.txt: agglomerative clustering result, containing index and feature names; | ||
| + | |||
2. 3196_17_0.8_4_NS.txt: pair-wise neighborhood similarity matrix of feature clusters; | 2. 3196_17_0.8_4_NS.txt: pair-wise neighborhood similarity matrix of feature clusters; | ||
| + | |||
3. Shanbhag.txt: | 3. Shanbhag.txt: | ||
| + | |||
4. 3196_17_0.8_4_AutoSelFeatures.txt: selected feature index and names; | 4. 3196_17_0.8_4_AutoSelFeatures.txt: selected feature index and names; | ||
| + | |||
5. data_selected_vis.txt: table of normalized data with selected features for visualization; | 5. data_selected_vis.txt: table of normalized data with selected features for visualization; | ||
| + | |||
6. vis_coordinates.txt: output visualization coordinates after dimension reduction by t-SNE. | 6. vis_coordinates.txt: output visualization coordinates after dimension reduction by t-SNE. | ||
== Gallery == | == Gallery == | ||
Revision as of 16:42, 21 August 2014
Contents |
Software Interface
Procedure
Output files
For 17 samples of 3196 dimensions, clustering sigma = 0.8, k = 4:
1. 3196_17_0.8_clustering.txt: agglomerative clustering result, containing index and feature names;
2. 3196_17_0.8_4_NS.txt: pair-wise neighborhood similarity matrix of feature clusters;
3. Shanbhag.txt:
4. 3196_17_0.8_4_AutoSelFeatures.txt: selected feature index and names;
5. data_selected_vis.txt: table of normalized data with selected features for visualization;
6. vis_coordinates.txt: output visualization coordinates after dimension reduction by t-SNE.
