Nuclear Segmentation
| (25 intermediate revisions by 3 users not shown) | |||
| Line 3: | Line 3: | ||
== Overview of the Algorithm == | == Overview of the Algorithm == | ||
| − | Automatic segmentation of cell nuclei is a widely needed essential step several biological applications. Although much progress has been made, this step continues to require improvements in accuracy, speed, level of automation, and ease of adaptability to new applications. | + | Automatic segmentation of cell nuclei is a widely needed essential step in several biological applications. Although much progress has been made, this step continues to require improvements in accuracy, speed, level of automation, and ease of adaptability to new applications. |
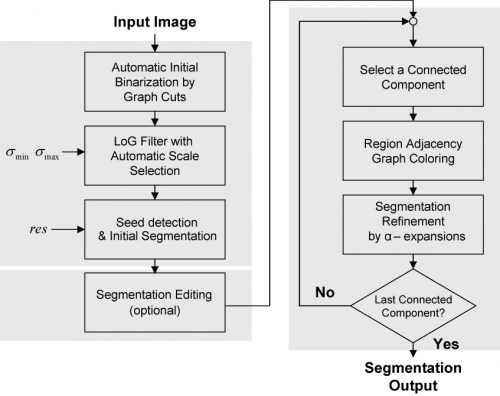
The segmentation process starts by binarizing the image based on the Graph-Cuts algorithm with automatic learning using minimum error thresholding. In the second step, the nuclear channel image is transformed into another one in which nuclei are represented by blobs of which local maxima points are used to represent seed points of nuclei. The transformation is achieved using a multi-scale Laplacian of Gaussian (LoG) filter, with the addition of automatic and adaptive scale selection. Given a set of seed points and the output of the LoG filter, the next step is to delineate each nucleus. For this, we use a fast clustering technique, called local maximum clustering. In the last step, nuclear contours are refined using a multi-label graph-cuts approach with alpha-expansions. In order to reduce memory requirements and processing time, alpha-expansions is preceded by a graph-coloring step that permits processing a large number of nuclei in parallel. Figure 1 shows a flow-chart illustrating the different steps of our work. | The segmentation process starts by binarizing the image based on the Graph-Cuts algorithm with automatic learning using minimum error thresholding. In the second step, the nuclear channel image is transformed into another one in which nuclei are represented by blobs of which local maxima points are used to represent seed points of nuclei. The transformation is achieved using a multi-scale Laplacian of Gaussian (LoG) filter, with the addition of automatic and adaptive scale selection. Given a set of seed points and the output of the LoG filter, the next step is to delineate each nucleus. For this, we use a fast clustering technique, called local maximum clustering. In the last step, nuclear contours are refined using a multi-label graph-cuts approach with alpha-expansions. In order to reduce memory requirements and processing time, alpha-expansions is preceded by a graph-coloring step that permits processing a large number of nuclei in parallel. Figure 1 shows a flow-chart illustrating the different steps of our work. | ||
| Line 9: | Line 9: | ||
[[Image:Nuc_seg_flow_chart.png |thumb|500px|Flow chart outlining the main steps in the nuclear segmentation algorithm|center]] | [[Image:Nuc_seg_flow_chart.png |thumb|500px|Flow chart outlining the main steps in the nuclear segmentation algorithm|center]] | ||
| − | |||
== Running the Program == | == Running the Program == | ||
| Line 16: | Line 15: | ||
| − | + | Usage1: | |
| + | segment_nuclei.exe <InputImageFileName> <OutputImageFileName> | ||
| + | Usage2: | ||
segment_nuclei.exe <InputImageFileName> <OutputImageFileName> <ParametersFileName> | segment_nuclei.exe <InputImageFileName> <OutputImageFileName> <ParametersFileName> | ||
| + | |||
*The input file is any 2-D or 3-D image with an ITk supported type. | *The input file is any 2-D or 3-D image with an ITk supported type. | ||
*The output file is a 'tif' image holding the labeled image. | *The output file is a 'tif' image holding the labeled image. | ||
| − | *The parameters file is a text file containing the parameters values | + | *If no parameters file name is provided, the program will estimate their values automatically (Usage 1). |
| + | *The parameters file is a text file containing the parameters values (Usage 2). | ||
== Description of the Parameters == | == Description of the Parameters == | ||
| + | A sample parameters file: | ||
! Segmentation parameters File | ! Segmentation parameters File | ||
! All parameters are case sensitive | ! All parameters are case sensitive | ||
| − | |||
high_sensitivity : 1 | high_sensitivity : 1 | ||
LoG_size : 30 | LoG_size : 30 | ||
| Line 39: | Line 42: | ||
Use_Distance_Map : 1 | Use_Distance_Map : 1 | ||
refinement_range : 5 | refinement_range : 5 | ||
| + | |||
| + | |||
| + | '''The parameters are as follows:''' | ||
| + | *high_sensitivity: a boolean parameter used to enable(1)/disable(0) high sensitivity binarization. Default value is (0). | ||
| + | *LoG_size: Not used anymore and will be removed | ||
| + | *min_scale: the minimum scale of the Laplacian of Gaussian filter. | ||
| + | *max_scale: the maximum scale of the Laplacian of Gaussian filter. | ||
| + | *xy_clustering_res: resolution of the local maximum clustering (in the x-y plane) used in the initial binarization step | ||
| + | *z_clustering_res: resolution of the local maximum clustering (along z) used in the initial binarization step | ||
| + | *finalize_segmentation: a boolean parameter used to enable(1)/disable(0) the segmentation refinement step | ||
| + | *sampling_ratio_XY_to_Z: ratio of image sampling along Z to the sampling in X-Y | ||
| + | *Use_Distance_Map: a boolean parameter used to enable(1)/disable(0) the use of the distance constraint to select the LoG scales | ||
| + | *refinement_range: If segmentation finalization (refinement) is enabled, this parameter sets the maximum distance that an initial contour can be shifted | ||
== Sample Results == | == Sample Results == | ||
| + | '''*2-D segmentation''' | ||
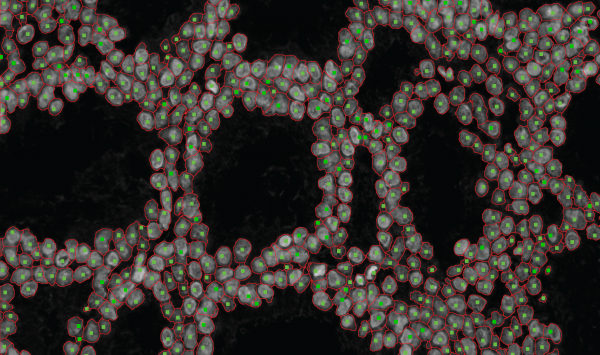
| + | [[Image:Sample2D.png |thumb|600px|*segmentation results of a cropped region from a 2-D nuclear image with seed points superimposed|center]] | ||
| + | |||
| + | '''*3-D segmentation''' | ||
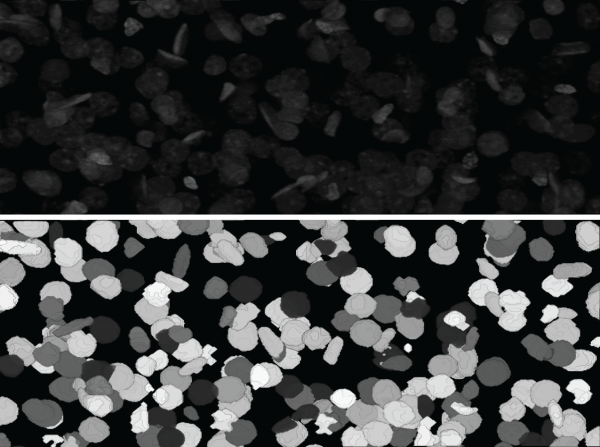
| + | [[Image:Sc_16.png |thumb|600px|*Top: screen shot of a 3-D rendering of a 3-D nuclear image | ||
| + | *Bottom: screen shot of a 3-D rendering of the segmentation results.|center]] | ||
| + | |||
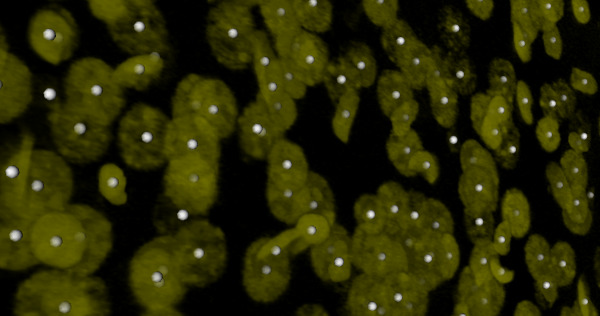
| + | [[Image:Sc2.png |thumb|600px|*screen shot of a 3-D rendering of a 3-D nuclear image with seed points superimposed|center]] | ||
| + | |||
| + | ==Related Links:== | ||
== References == | == References == | ||
| + | Al-Kofahi Y, Lassoued W, Lee W, Roysam B. Improved Automatic Detection & Segmentation of Cell Nuclei in Histopathology Images. IEEE Trans Biomed Eng 2009((accepted)). | ||
Latest revision as of 12:06, 17 July 2010
This page provides a brief overview of the nuclear segmentation algorithm, usage instruction, parameter description, and sample results.
Contents |
Overview of the Algorithm
Automatic segmentation of cell nuclei is a widely needed essential step in several biological applications. Although much progress has been made, this step continues to require improvements in accuracy, speed, level of automation, and ease of adaptability to new applications.
The segmentation process starts by binarizing the image based on the Graph-Cuts algorithm with automatic learning using minimum error thresholding. In the second step, the nuclear channel image is transformed into another one in which nuclei are represented by blobs of which local maxima points are used to represent seed points of nuclei. The transformation is achieved using a multi-scale Laplacian of Gaussian (LoG) filter, with the addition of automatic and adaptive scale selection. Given a set of seed points and the output of the LoG filter, the next step is to delineate each nucleus. For this, we use a fast clustering technique, called local maximum clustering. In the last step, nuclear contours are refined using a multi-label graph-cuts approach with alpha-expansions. In order to reduce memory requirements and processing time, alpha-expansions is preceded by a graph-coloring step that permits processing a large number of nuclei in parallel. Figure 1 shows a flow-chart illustrating the different steps of our work.
Running the Program
In addition to its use in the GUI, a stand-alone nuclear segmentation executable is available.
Usage1:
segment_nuclei.exe <InputImageFileName> <OutputImageFileName>
Usage2:
segment_nuclei.exe <InputImageFileName> <OutputImageFileName> <ParametersFileName>
- The input file is any 2-D or 3-D image with an ITk supported type.
- The output file is a 'tif' image holding the labeled image.
- If no parameters file name is provided, the program will estimate their values automatically (Usage 1).
- The parameters file is a text file containing the parameters values (Usage 2).
Description of the Parameters
A sample parameters file:
 ! Segmentation parameters File
 ! All parameters are case sensitive
 high_sensitivity	 :	1
 LoG_size	         :	30
 min_scale	         :	4
 max_scale	         :	6
 xy_clustering_res	 :	2
 z_clustering_res	 :	1
 finalize_segmentation	 :	1
 sampling_ratio_XY_to_Z :	2
 Use_Distance_Map	 :	1
 refinement_range	 :	5
The parameters are as follows:
- high_sensitivity: a boolean parameter used to enable(1)/disable(0) high sensitivity binarization. Default value is (0).
- LoG_size: Not used anymore and will be removed
- min_scale: the minimum scale of the Laplacian of Gaussian filter.
- max_scale: the maximum scale of the Laplacian of Gaussian filter.
- xy_clustering_res: resolution of the local maximum clustering (in the x-y plane) used in the initial binarization step
- z_clustering_res: resolution of the local maximum clustering (along z) used in the initial binarization step
- finalize_segmentation: a boolean parameter used to enable(1)/disable(0) the segmentation refinement step
- sampling_ratio_XY_to_Z: ratio of image sampling along Z to the sampling in X-Y
- Use_Distance_Map: a boolean parameter used to enable(1)/disable(0) the use of the distance constraint to select the LoG scales
- refinement_range: If segmentation finalization (refinement) is enabled, this parameter sets the maximum distance that an initial contour can be shifted
Sample Results
*2-D segmentation
*3-D segmentation
Related Links:
References
Al-Kofahi Y, Lassoued W, Lee W, Roysam B. Improved Automatic Detection & Segmentation of Cell Nuclei in Histopathology Images. IEEE Trans Biomed Eng 2009((accepted)).


