3D Subcellular Location Features
(→Definition of the Haralick Texture Features) |
(→Definitions of the Haralick Texture Features) |
||
| (42 intermediate revisions by one user not shown) | |||
| Line 46: | Line 46: | ||
*3D-SLF11.18/31 Average/range of contrast | *3D-SLF11.18/31 Average/range of contrast | ||
*3D-SLF11.19/32 Average/range of correlation //some modifications have been made for these two features, for details please refer to the Demo report in the Demo package | *3D-SLF11.19/32 Average/range of correlation //some modifications have been made for these two features, for details please refer to the Demo report in the Demo package | ||
| − | *3D-SLF11.20/33 Average/range of sum of squares of variance //An error in the original definition is corrected | + | *3D-SLF11.20/33 Average/range of sum of squares of variance //An error in the original definition is corrected |
| + | |||
| + | *3D-SLF11.21/34 Average/range of inverse difference moment | ||
*3D-SLF11.22/35 Average/range of sum average | *3D-SLF11.22/35 Average/range of sum average | ||
*3D-SLF11.23/36 Average/range of sum variance | *3D-SLF11.23/36 Average/range of sum variance | ||
| Line 57: | Line 59: | ||
== The Code for Computing 3D_SLF Features == | == The Code for Computing 3D_SLF Features == | ||
| − | |||
| − | |||
| − | |||
=== Usage of the Code === | === Usage of the Code === | ||
| Line 66: | Line 65: | ||
Usage: | Usage: | ||
SLFFeatureCal.exe [string1] [string2] [integer1] [integer2] [string3] | SLFFeatureCal.exe [string1] [string2] [integer1] [integer2] [string3] | ||
| − | |||
| − | |||
string1 The part of file name that shared by all protein images | string1 The part of file name that shared by all protein images | ||
string2 The part of file name that shared by all DNA images | string2 The part of file name that shared by all DNA images | ||
| Line 75: | Line 72: | ||
| − | The code also can compute 3D_SLF from one 3D image which contains many cells of different types, and its corresponding label image (which contains the cell segmentation results), one feature vector will be obtained for each cell. To do this, we can use following command: | + | The code also can compute 3D_SLF from one 3D image which contains many cells of different types, and its corresponding label image (Figure.1)(which contains the cell segmentation results), one feature vector will be obtained for each cell. To do this, we can use following command: |
| − | |||
| − | [[Image: | + | [[Image:Ncu.jpg|thumb|right|200px| Figure.1(a) Original image containing cells of different types]] |
| + | [[Image:Ncu_label.jpg|thumb|200px| Figure.1(b) The label image|right]] | ||
Usage: | Usage: | ||
SLFFeatureCal_V2.exe [string1] [string2] [string3] | SLFFeatureCal_V2.exe [string1] [string2] [string3] | ||
| − | |||
| − | |||
string1 The original 3D image | string1 The original 3D image | ||
string2 The label image (containing the cell segmentation results) | string2 The label image (containing the cell segmentation results) | ||
string3 The name of the output txt files which records the obtained feature vectors | string3 The name of the output txt files which records the obtained feature vectors | ||
| − | [[Image:ScreenShot.jpg|thumb| | + | [[Image:ScreenShot.jpg|thumb|left|200px| Figure.2 A screenshot for running the feature computation code]] |
| − | + | == Two Applications of the SLFs == | |
| + | SLFs can be applied for Cell Analysis and Classification | ||
| + | :*[http://farsight-toolkit.org/wiki/Applications_of_SLFs''' Cell Analysis and Classification'''] | ||
== Reference == | == Reference == | ||
| Line 102: | Line 99: | ||
== Appendix == | == Appendix == | ||
| − | === | + | === Definitions of the Haralick Texture Features === |
| − | [ | + | * [http://www.farsight-toolkit.org/wiki/Equations_for_3D_Haralick_Texture_Feature '''Equations for the Haralick Texture Features'''] |
| − | + | for more information, please refer to [3] and the Demo report below | |
=== A Demo Report for the Code === | === A Demo Report for the Code === | ||
| − | [[http://www.rpi.edu/~wangy15/Demo.pdf | + | A Demo report descripting more details about the code and the verification results can be found in following link |
| + | [[http://www.rpi.edu/~wangy15/Demo.pdf Demo Report]]. | ||
Latest revision as of 03:25, 27 April 2009
3D Subcellular Location Features (SLF) are a product of [Dr. Robert Murphy's laboratory]. They are useful for quantifying the spatial distribution of an intracellular molecule (usually a protein) around a cell nucleus that is assumed to be imaged in a separate channel. They are a class of associative features in FARSIGHT terminology.
A C++ implementation of SLFs is now available within FARSIGHT. The following paragraphs are largely adapted from Dr. Murphy's papers and are intended to educate the users of FARSIGHT to these features. Readers should refer to the publications listed below for more information.
Contents |
3D Subcellular Location Features
Knowing the subcellular location of a protein is critical to a full understanding of its function[4]. Several sets of numerical features (Subcellular Location Features, SLF) have been developed to describe protein subcellular location patterns in 2D fluorescence microscope image by Bob Murphy and his colleagues[1]. However, compared to 3D images, 2D images would not capture sufficient information about protein location in some cell types. In [2], several sets of 3D SLF (SLF11: 56 features, SLF9: 28 features) are proposed for extracting more useful information from 3D fluorescence microscope image. SLF11 and SLF9 are consisted of three types of 3D features, namely, morphological, edge and texture features. After feature selection (e.g. by stepwise discriminant analysis, SDA), or downsampling (e.g. calculate texture features at 0.5 microns and 64 gray levels), SLF11 and SLF9 can be extended to other feature sets like SLF10, 11, 14, 17, 18, 19, 20, 22, 23, 24. The code we developed is for 3D SLFs computation.
3D Morphological Features
3D morphological feature set consisting of 28 features is derived from morphological and geometric image analysis. Some of them are associative features since they are calculated from both protein and DNA images. All the morphological features are listed below (for more information, please refer to [1]):
- SLF9.1 - The number of fluorescent objects in the image: A 3D object is defined as a group of contiguous, above-threshold voxels in a 26-connected environment.
- SLF9.2 - The Euler number of the image: This is the difference between number of objects and number of holes in the image.
- SLF9.3 - The average object volume: The volume of an object is defined as the number of voxels in the object.
- SLF9.4 - The standard deviation of object volumes.
- SLF9.5 - The ratio of the max object volume to min object volume.
- SLF9.6 - The average object distance to the protein center of fluorescence (COF).
- SLF9.7 - The standard deviation of object distances from the protein COF.
- SLF9.8 - The ratio of the largest to the smallest object to protein COF distance.
- SLF9.9 - The average object distance to the COF of the DNA image. //Note that the objects are those in the protein image, not the DNA image.
- SLF9.10 - The standard deviation of object distances from the COF of the DNA image.
- SLF9.11 - The ratio of the largest to the smallest object to DNA COF distance.
- SLF9.12 - The distance between the protein COF and the DNA COF.
- SLF9.13 - The ratio of the volume occupied by protein to that occupied by DNA.
- SLF9.14 - The fraction of the protein fluorescence that co-localizes with DNA.
- SLF9.15 - The average horizontal distance of objects to the protein COF.
- SLF9.16 - The standard deviation of object horizontal distances from the protein COF.
- SLF9.17 - The ratio of the largest to the smallest object to protein COF horizontal distance.
- SLF9.18 - The average vertical distance of objects to the protein COF.
- SLF9.19 - The standard deviation of object vertical distances from the protein COF.
- SLF9.20 - The ratio of the largest to the smallest object to protein COF vertical distance.
- SLF9.21 - The average object horizontal distance from the DNA COF.
- SLF9.22 - The standard deviation of object horizontal distances from the DNA COF.
- SLF9.23 - The ratio of the largest to the smallest object to DNA COF horizontal distance.
- SLF9.24 - The average object vertical distance from the DNA COF.
- SLF9.25 - The standard deviation of object vertical distances from the DNA COF.
- SLF9.26 - The ratio of the largest to the smallest object to DNA COF vertical distance.
- SLF9.27 - The horizontal distance between the protein COF and the DNA COF.
- SLF9.28 - The signed vertical distance between the protein COF and the DNA COF:
3D Edge Features
- 3D-SLF11.15 The fraction of above threshold pixels that are along an edge
- 3D-SLF11.16 The fraction of fluorescence in above threshold pixels that are along an edge
3D Texture Features
- 3D-SLF11.17/30 Average/range of angular second moment
- 3D-SLF11.18/31 Average/range of contrast
- 3D-SLF11.19/32 Average/range of correlation //some modifications have been made for these two features, for details please refer to the Demo report in the Demo package
- 3D-SLF11.20/33 Average/range of sum of squares of variance //An error in the original definition is corrected
- 3D-SLF11.21/34 Average/range of inverse difference moment
- 3D-SLF11.22/35 Average/range of sum average
- 3D-SLF11.23/36 Average/range of sum variance
- 3D-SLF11.24/37 Average/range of sum entropy
- 3D-SLF11.25/38 Average/range of entropy
- 3D-SLF11.26/39 Average/range of difference variance
- 3D-SLF11.27/40 Average/range of difference entropy
- 3D-SLF11.28/41 Average/range of info measure of correlation 1
- 3D-SLF11.29/42 Average/range of info measure of correlation 2 //The original definition is modified to avoid computation instability and error
The Code for Computing 3D_SLF Features
Usage of the Code
For computing 3D_SLF from single cell 3D images (image series), we can use this command:
Usage:
SLFFeatureCal.exe [string1] [string2] [integer1] [integer2] [string3]
            string1  The part of file name that shared by all protein images
            string2  The part of file name that shared by all DNA images
            integer1 The start index of the image series
            integer2 The end index of the image series
            string3  The name of the output txt file which records the obtained feature vector
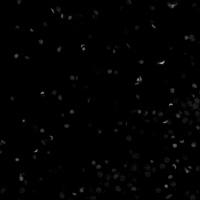
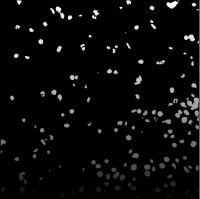
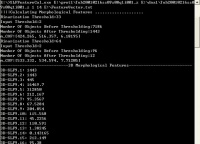
The code also can compute 3D_SLF from one 3D image which contains many cells of different types, and its corresponding label image (Figure.1)(which contains the cell segmentation results), one feature vector will be obtained for each cell. To do this, we can use following command:
Usage:
SLFFeatureCal_V2.exe [string1] [string2] [string3]
            string1  The original 3D image
            string2  The label image (containing the cell segmentation results)
            string3  The name of the output txt files which records the obtained feature vectors
Two Applications of the SLFs
SLFs can be applied for Cell Analysis and Classification
Reference
- [1] http://murphylab.web.cmu.edu/services/SLF/
- [2] Xiang Chen, Meel Velliste, “Location proteomics - Building subcellular location trees from high resolution 3D fluorescence microscope images of randomly-tagged proteins”. Proceedings of SPIE Vol. 4962, 2003.
- [3] R. Haralick, K. Shanmugam, and I. Dinstein, "Textural features for image classification," IEEE Transactions on Systems, Man, and Cybernetics, SMC-3, 610-621, 1973.
- [4] Meel Velliste, Robert F. Murphy, “Automated Determination of Protein Subcellular locations from 3D Fluorescence Microscope Images”, 2003.
- [5] http://www.rpi.edu/~wangy15/Demo.pdf.
Appendix
Definitions of the Haralick Texture Features
for more information, please refer to [3] and the Demo report below
A Demo Report for the Code
A Demo report descripting more details about the code and the verification results can be found in following link [Demo Report].


