Segmentation Viewer
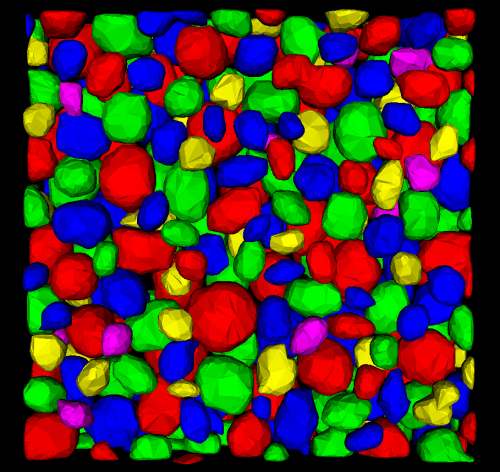
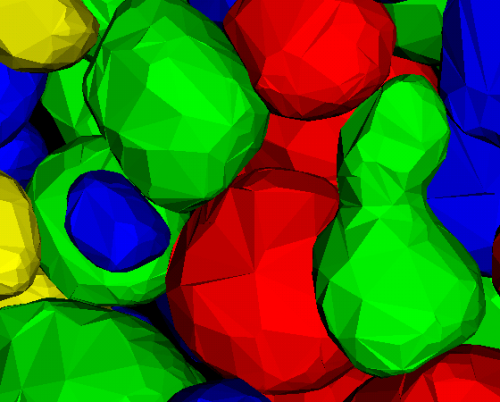
A Segmentation Viewer is available inside of the Nuclear Segmentation module. The purpose of this viewer is to display segmentation output using graph coloring, so that neighboring segmented objects are colored differently and thus distinguishable from each other. This proves useful in visualizing segmentation results for user validation.
This viewer takes a .txt parameter file of the following format of image scale (in x, y, z) on the first line, and the input file name on the second. The only acceptable image file format for the input file is TIFF.
ex.
1.0 1.0 2.0
mySegmentationOutput.tiff
The program is run out of a terminal, with the following command:
segren.exe <ParameterFileName>
This viewer uses the graph coloring algorithm implemented in the Nuclear Segmentation module, and implements much of the rendering code found in Rendering module. Both the graph coloring output images, and the polygonal data files created in the rendering process are cached in a sub-directory of the working directory of the executable.
Test data (seen in the above images) is found in the TestData folder in the FARsight svn repository:
phant3D_11_img_label.tif

