TissueNets Program
| Line 22: | Line 22: | ||
[[Image:sample2.jpeg]] | [[Image:sample2.jpeg]] | ||
| − | TissueNets provides options to make proper selections. If the user wants to display a standard network, he/she can also display ''pyramidal regions'' by entering a '''cutoff''' point. When this option is selected, the average edge lengths that are used in pyramidal region computation will be produced in the file called ''pyramidal.txt''. In addition, it is also possible to display links that are shorter than or equal to a given '''distance'''. In the following picture, the white cells are located outside the pyramidal region whose cutoff point is 50. | + | TissueNets provides options to make proper selections. If the user wants to display a standard network, he/she can also display ''pyramidal regions'' by entering a '''cutoff''' point. When this option is selected, the average edge lengths that are used in pyramidal region computation will be produced in the file called ''pyramidal.txt''. In addition, it is also possible to display links that are shorter than or equal to a given '''distance'''. In the following picture, the white cells are located outside the pyramidal region whose cutoff point is 50. In this case, yellow spheres represent microglia and purple ones are neurons. |
[[Image:sample3.jpeg]] | [[Image:sample3.jpeg]] | ||
Revision as of 17:10, 2 April 2009
TissueNets program is mainly used for creating and displaying brain Tissue Networks. In addition, it is also possible to generate and display histograms based on the user's feature selections that are read from the input file. The program also provides users with sample input combination for demo purposes. TissueNets has the following menu selections:
Contents |
Create Network
In general, the following steps are used for constructing a tissue network:
Step1: Define the Nodes
which create nodes of the network
Step2: Define the Links
which creates links based on k-nearest neighbor algorithm (with exact solution).
Step3: Form the Network
which combines nodes and links and creates a network in XGMML form
Display Network
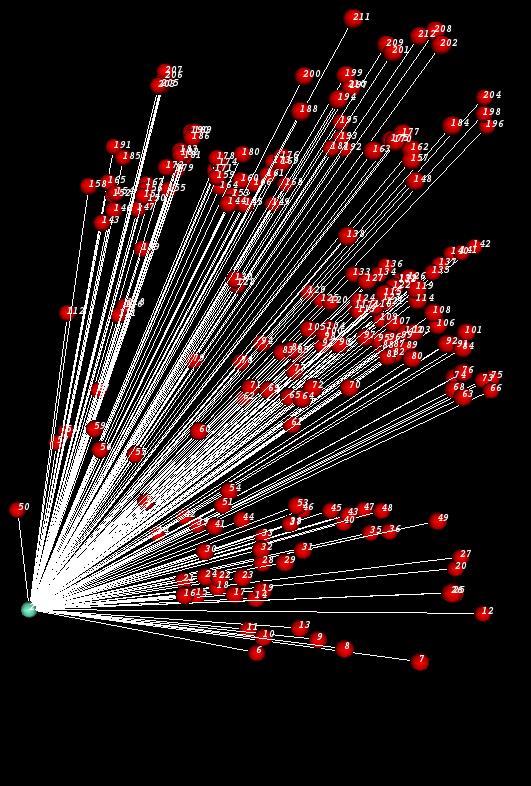
Once a network is created, TissueNets will help you to display it. After the network is displayed, the user can zoom and rotate the network to get a better view. Here is a sample network displayed by TissueNets:
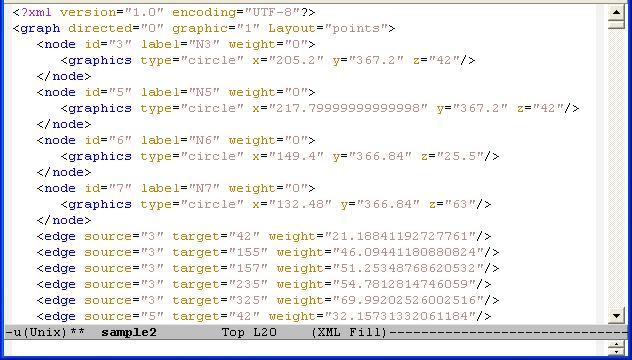
TissueNets display networks in two different forms. The first one is just a standard network that consists of nodes and links (edges) defined in a network definition file (NDF) which is given as an input. The second type of networks is minimum-spanning trees that are generated from network definition files. A sample NDF which has to be defined as an XGMML file is shown below:
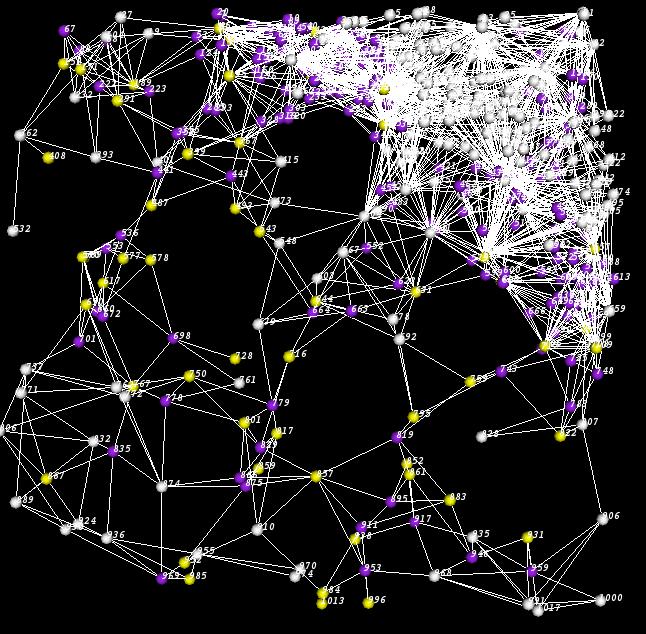
TissueNets provides options to make proper selections. If the user wants to display a standard network, he/she can also display pyramidal regions by entering a cutoff point. When this option is selected, the average edge lengths that are used in pyramidal region computation will be produced in the file called pyramidal.txt. In addition, it is also possible to display links that are shorter than or equal to a given distance. In the following picture, the white cells are located outside the pyramidal region whose cutoff point is 50. In this case, yellow spheres represent microglia and purple ones are neurons.
USAGE:
If the user has mouse access:
  - scroll wheel zooms in and out
  - left mouse button is used for making selections
  - right mouse button is used for rotating the network
The user also can use the keyboard:
- key 'x' is used for rotating the network counter-clockwise by the x-axis (10 degrees each time).
Similarly SHIFT+'x' rotates clockwise by the x-axis.
- key 'y' is used for rotating the network counter-clockwise by the y-axis (10 degrees each time).
Similarly SHIFT+'y' rotates clockwise by the y-axis.
- key 'z' is used for rotating the network counter-clockwise by the z-axis (10 degrees each time).
Similarly SHIFT+'z' rotates clockwise by the z-axis.
- 'Delete' key deletes the selected vertices and edges


