The Worm Project
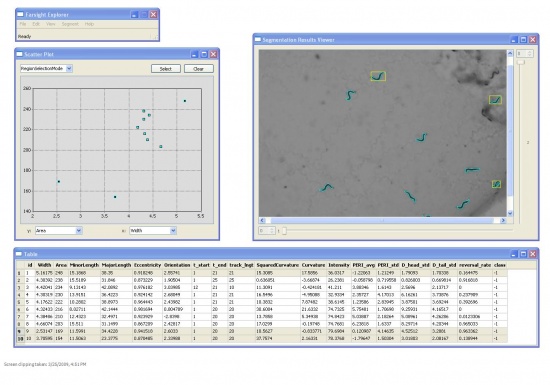
The Worm module of FARSIGHT is a toolkit of computational methods designed to segment and track a population of C. elegans worms. The segmentation and tracking data can be used to identify locomotion events, and to quantify the impact of worm locomotion on external influences (e.g., pheromones). Worms are tracked according to their distance from the pheromone spots and morphological features are computed from the image data for each worm. We present the application of a physically motivated approach to modeling the dynamic movements of the nematode C. elegans exposed to an external stimulus as observed in time-lapse microscopy image sequences. Specifically, we model deformation patterns of the central spinal axis of various phenotypes of these nematodes which have been exposed to pheromone produced by wild type C. elegans Worms are tracked according to their distance from the pheromone spots and intrinsic features are computed from the image data for each worm. The features measured include those proposed by Nicolas Roussel and those provided in the FARSIGHT Toolkit.
A model based algorithm for simultaneously segmenting and tracking of an entire imaging field containing multiple worms previously proposed by Nicolas Roussel has been implemented an applied to model worm behavior. An extension to the work propped by Roussel et. al., is to create a map of the worm’s behavior over time similar to the kymographs used by biologists to improve the accuracy of multiple hypothesis tracking by eliminating hypothesis based on a Euclidean distance metric to the worm kymograph. Interaction between worms is typically modeled as a random walk. We seek to give biologists a new tool to isolate the paths of peristaltic progression of C. elegans leads to unpredictable behaviors that are resolved using a variant of multiple-hypothesis tracking. The net result is an integrated method to understand and quantify worm interactions. Experimental results indicate that the proposed algorithms allow for an integrated high throughput automated analysis of the locomotive behavior of C. elegans during exposure to a given pheromone. The results for this work are generated by a module of the FARSIGHT toolkit for segmentation and tracking of multiple biological systems. The features calculated during this work can be edited and validated using the tracking editor available in the FARSIGHT toolkit. Overall, the method provides the basis for a new range of quantification metrics for nematode social behaviors.
Contents |
Modules
The modules of The Worm Project are aimed at:
Exploiting complete worm track sequence to model movement and deformation in a correlated manner
- Modeling interaction and overlap using known locomotion events to exclude unfavorable hypothesis
- Extending existing probabilistic approach to measurement and prediction using track summary
Detection
Worms are modeled according to centerline and width profile.
Information about the entire image sequence is obtained by projecting the maximum intensity of
the sequence which is followed by a segmentation step.
Syntax:
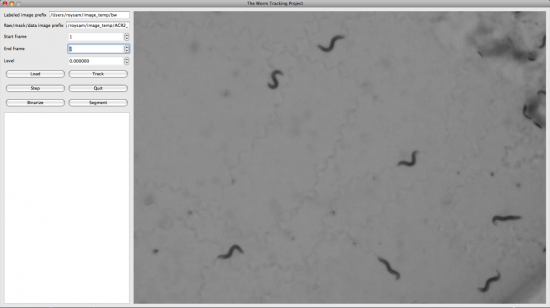
To binarize a set of images, input the prefix of the image set in the first text field, and the full name of the mask image in the second. The upper threshold is specified as a percentage, from zero to one, in the level field. (This is the same as in MATLAB.) Then select "Binarize".
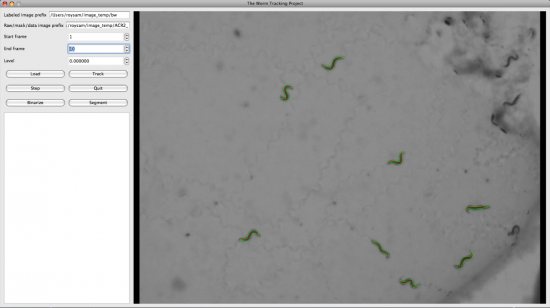
To segment a set of images, specify the prefix of the input images and data files in the two text fields, select the frame range, and press "Segment".
WormBinarization
- WormBinarization accepts a series of grayscale images and returns a series of corresponding binary images
- The mask file used as an input is generated by performing a maximum intensity projection of the entire image sequence.
- The input images should be single-slice 8-bit TIFs. Other image formats have not been tested.
- The frame number must have n digits. We have tested this data with n == 4.
- The frame number must be at to the end of the image name.
Tracking
Syntax:
The "track" button starts tracking after a set of images is loaded. The two file name fields are used for the labeled image and raw image, respectively. The "level" field is not used.
A center-line is extracted for all of the ‘tracks’ in the summary view of the image sequence.
The Euclidean distance from the worm center-line in each time step to the center-lines in extracted in
the summary view.
All hypothesis which are 1.2 times this distance are excluded from the possibilities used during tracking.
Example Input
To track worms with the following image sequence...
C:\data\Im0000.tif
C:\data\Im0001.tif
C:\data\Im0002.tif
C:\data\Im0003.tif
C:\data\Im0004.tif
...with their associated labeled image sequence...
C:\data\labeled0000.tif
C:\data\labeled0001.tif
C:\data\labeled0002.tif
C:\data\labeled0003.tif
C:\data\labeled0004.tif
A worm is selected by left-clicking to define a spline down the center of the worm, and then a middle-click when all points have been selected. The mouse wheel may be used to zoom in or out. If you make a mistake while defining the spline, a right-click will undo the last point that you selected.
Example Output
Features
Worms are tracked according to their distance from the pheromone spots and intrinsic features are computed from the image data for each worm.
|
Name |
Description |
Formula |
|
Width |
Model of worm Width |
|
|
Area |
Number of pixels in the worm |
| Ω | |
|
Minor Length |
Minor axis length of an ellipse with the same area as the worm which has been fit to our worm model |
|
|
Major Length |
Major axis length of an ellipse with the same area as the worm which has been fit to our worm model |
|
|
Eccentricity |
Ratio of maximum to minimum distance of the center of mass from the worm’s surface |
|
|
Orientation |
Angle between the first principal axis of a given worm and the ‘x’ axis |
|
|
t_start |
Frame number that worm was initially detected |
Ft(0) |
|
t_end |
Frame number that worm was last detected |
|
|
t_length |
Total number of frames worm was tracked in a given image sequence |
|
|
Curvature |
A metric to give an estimate of coiling as a worm behavior |
|
|
Sum Squared Curvature |
Average Curvature squared, gives an estimate of the worm’s bending energy |
|
|
Intensity |
The average intensity of the pixels in a worm |
mean( | Ω | ) |
|
Peri_avg |
The average worm speed |
mean([ui,...,un]) i=1,2,...,15 |
|
Peri_std |
The standard deviation of the worm speed. Gives users insight into irregularities of worm peristaltic progression |
std([ui,...,un]) i=1,2,...,15 |
|
D_head_std |
Standard deviation of the displacement of the worm’s head |
|
|
D_tail_std |
Standard deviation of the displacement of the worm’s tail |
|
|
Reversal Rate |
The frequency of backward progression by the worm’s head |
|
|
Class |
Each Phenotype is given a separate class from 1-N |
N / A |
|
Bearing |
The angle between the velocity vector and the spatial vector from the worm’s position to the center of the pheromone spot(chemical gradient) |
|
|
Instantaneous Turning Rate |
The change in orientation over time |
|
Behaviors
- Nicolas Roussel, Christine A. Morton, Fern P. Finger, Badrinath Roysam, “A Computational Model for C. elegans Locomotory Behavior: Application to Multi-Worm Tracking,” vol. 54, no. 10, IEEE Transactions on Biomedical Engineering, October 2007.
- Pierce-Shimomura JT, Morse TM, Lockery SR, "The Fundamental Role of Pirouettes in Caenorhabditis elegans Chemotaxis," The Journal of Neuroscience. 1999 Nov; 19(21):9557–9569.


![\arctan[\cfrac{dy}{dx}]](/mw/images/math/4/d/2/4d2193edba86ebb76f3878d5c0903292.png)


![\theta = \arctan[\cfrac{dv}{ds}]](/mw/images/math/f/a/b/fab28f3ddd9d93d46271bec6662f7934.png)
![[\cfrac{d\phi}{dt}]](/mw/images/math/5/0/7/50750121d1ccc9dccfd70bb9297fedbd.png)