The Worm Project
For Our New Worm Analysis System, Please Refer to [Worm Analysis System]
Contents |
Introductiom
The Worm module of FARSIGHT is a toolkit of computational methods designed to segment and track a population of C. elegans worms. The segmentation and tracking data can be used to identify locomotion events (e.g., pirouettes), and to quantify the impact of worm locomotion on external influences (e.g., pheromones). Worms are tracked according to their distance from the pheromone spots and morphological features are computed from the image data for each worm. We present the application of a physically motivated approach to modeling the dynamic movements of the nematode C. elegans exposed to an external stimulus as observed in time-lapse microscopy image sequences. Specifically, we model deformation patterns of the central spinal axis of various phenotypes of these nematodes which have been exposed to pheromone produced by wild type C. elegans Worms are tracked according to their distance from the pheromone spots and intrinsic features are computed from the image data for each worm. The features measured include those proposed by Nicolas Roussel and those provided in the FARSIGHT Toolkit.A model based algorithm for simultaneously segmenting and tracking of an entire imaging field containing multiple worms previously proposed by Nicolas Roussel has been implemented an applied to model worm behavior. An extension to the work propped by Roussel et. al., is to create a map of the worm’s behavior over time similar to the kymographs used by biologists to improve the accuracy of multiple hypothesis tracking by eliminating hypothesis based on a Euclidean distance metric to the worm kymograph. Interaction between worms is typically modeled as a random walk. We seek to give biologists a new tool to isolate the paths of peristaltic progression of C. elegans leads to unpredictable behaviors that are resolved using a variant of multiple-hypothesis tracking. The net result is an integrated method to understand and quantify worm interactions. Experimental results indicate that the proposed algorithms allow for an integrated high throughput automated analysis of the locomotive behavior of C. elegans during exposure to a given pheromone. The results for this work are generated by a module of the FARSIGHT toolkit for segmentation and tracking of multiple biological systems. The features calculated during this work can be edited and validated using the tracking editor available in the FARSIGHT toolkit. Overall, the method provides the basis for a new range of quantification metrics for nematode social behaviors.
Modules
The Worm Model
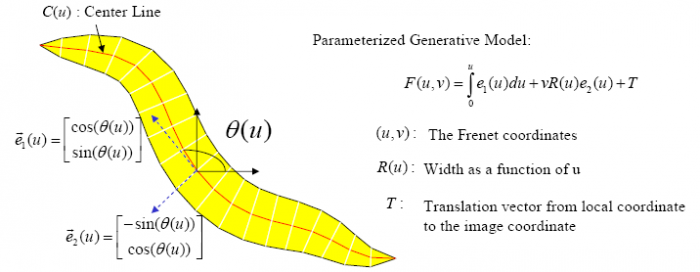
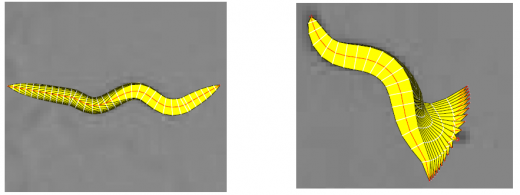
In the tracking system, we combine and modify the two worm models used in [1][2] to make them more suitable for model-based multi-worm tracking, static/dynamic feature extraction and event analysis. This generative model could be deformed to model the two types of worm's crawling movement, as shown in Figure 3.
The Detection Module
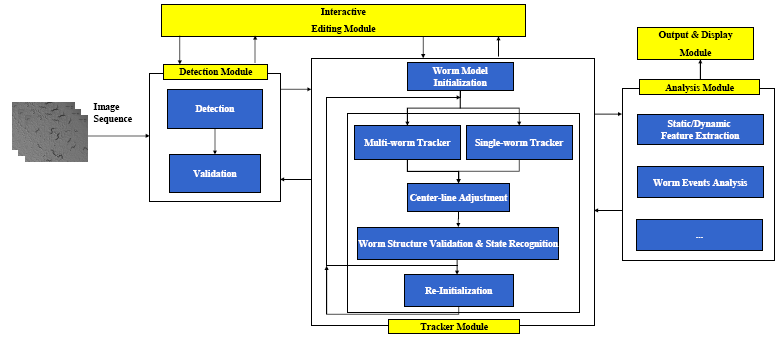
The tracker is automatically initialized by the detector. Worm detection generally involves:(1)Binarization and filling of small holes; (2)Extraction of the worm boundary based on the binary image; (3)Head and tail detection; (4)Center line and width computation; and (5)Instantiation of the worm model. In the detection module, detection is followed by the worm model validation to remove errors caused by spots in the background or overlapping worms. The detection module also corrects worms that were mis-tracked during the original tracking process. For more details about the detection module, please refer to:
The Tracking Module
The framework for the multi-worm tracker is shown in Figure 4. For more details about the tracker, please refer to:
The Analysis Module
The tracking results can be fed to the analysis module for static/dynamic feature extraction, and event analysis.
For a complete list of worm features, please refer to
The Display and Editing Modules
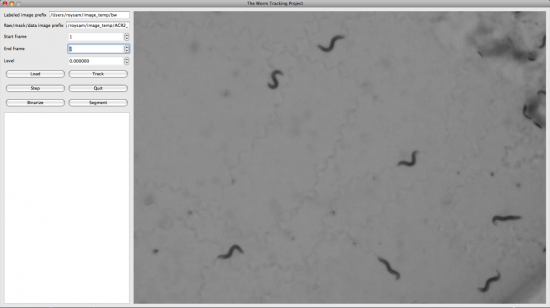
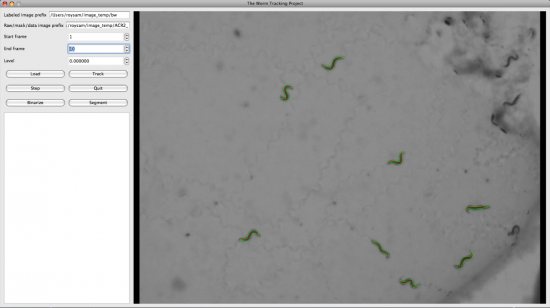
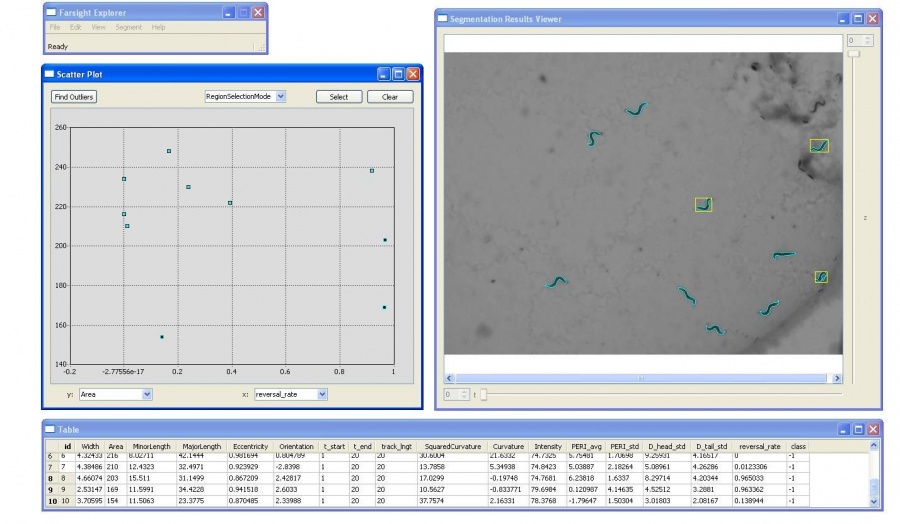
We also developed the display and editing modules for the Worm Tracker. The following screenshots were taken from them.
Usage of the tracker
For the console program for tracking without GUI, usage is as follows:
 MWT.exe FileName Index1 Index2 GrayThreshold AreaThreshold1 AreaThreshold2
         BGsub OuputDir ImageFormat

      FileName: Directory of the images
      Index1: First index of the images
      Index2: Last index of the images
      GrayThreshold: Threshold used for binarization
      AreaThreshold1: Minimum object area size
      AreaThreshold2: Maximum object area size
      BGsub: 1 = true  (compute background image first for images with cluttered background)
             0 = false (directly use thresholding and hole filling filter)
      OutputDir: Directory for storing the tracking result (a text file containing point lists, a labeled image, and a image
                 showing the tracking result)
      ImageFormat: Format of the images
 Example: MWT.exe E:/WormDemo/TestImages/LGC35ACR20 1 100 40 400 2000 1 E:/ bmp
          MWT.exe E:/WormDemo/TestImages/LGC35ACR20 1 100 85 400 2000 0 E:/ bmp
Selection of parameters: Users need to choose several parameters related to the computation of binary images. The quality of the binary images is very important for the tracking system.
- Threshold for binarization: Since the intensity of most worm images could be modeled as a mixture of N=2 Gaussian mixtures[1], when directly using the thresholding and hole filling filter for preprocessing, the threshold should be selected as the value separating the two Gaussian distributions, as shown in Figure 5. Intensities smaller than this threshold will be set to 1; the rest will be set to 0. When using a background image for subtraction, intensities larger than the selected threshold will be set to 1; this is the opposite of the behavior when the thresholding and hole filling filter is used directly. The threshold value also can be chosen based on the histogram.
- Minimum and maximum object area size: These are used to clean the background objects left after binarization. The user should try several values until desirable binary images are obtained.
- Background subtraction: For images a with cluttered background, this should be set to 1 (true). A background image would be computed first; for images with a clean background, this can be set to 0 (false). In this case, no background image will be computed, and direct thresholding and hole filling will be used.
For some examples of choosing parameters to reach desirable binary image, please refer to:
Python Implementation
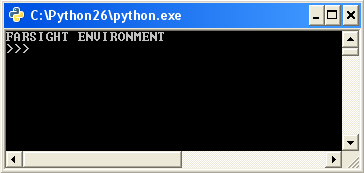
We have wrapped the above tracking system in a python script. A user can access the python script by opening a python window and importing the script called wormdemo.py.
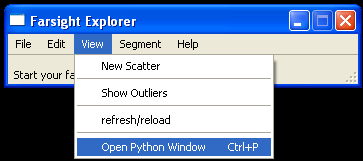
- From the Farsight GUI select View > Open Python Window to start the python interpreter.
- Load the wormdemo python script
- Place images in a directory within the current working directory
 current_path = os.getcwd()
 image_dir = "Images"
 os.chdir(current_path + os.sep + image_dir)
- Note that the script takes the parameters from the modules listed above as arguments for the subprocesses in the script
 args = current_path + os.sep + "executable_fname " + fname_binary + " " + fname_base + " " + start_frame + " " + end_frame
 A user can change the arguments used in the script by setting the variables to reflect the image names set in the image directory
- Choose an option from the list to perform
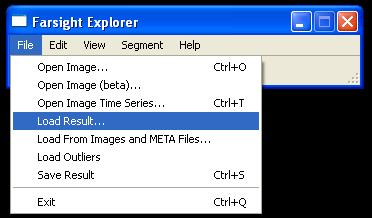
- To view output, use the GUI shown above to load the xml result file generated by executing modules
References
- [1] Nicolas Roussel, Badrinath Roysam, "A Computational Model for C.elegans Locomotory Behavior: Application to Multiworm tracking", IEEE Trans On Biomedical Engineering. Vol.54, No.10, Oct,2007.
- [2] Fontaine, E., Barr, A., Burdick, J. W., "Model-based tracking of multiple worms and fish", In ICCV Workshop on Dynamical Vision, 2007.
- [3] Fontaine, E., Lentink, D., Kranenbarg, S., Müller, U., van Leeuwen, J., Barr, A.H., Burdick, J. W. "Automated visual tracking for studying the ontogeny of zebrafish swimming", Journal of Experimental Biology, 211, 1305-1316, 2008.
- [4] Nicolas Roussel, "A Computational Model for C.elegans locomotory behavior: Application to Multi-Worm tracking", Phd Thesis, 2007.
