EVS
The Edit-based Validation System (EVS) provides a graphical user interface (GUI) useful for viewing and editing the result of automated image segmentation. For a general discussion of this topic, please visit the Validation Methods page. This GUI is built using a cross-platform framework for open-source application development called Qt (qtsoftware.com) and Kitware's Visualization Toolkit (VTK).
Contents |
Model-View Programming
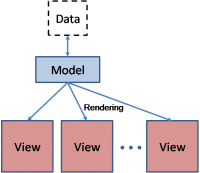
The model/view architecture is based on the model-view-controller (MVC) software design pattern from computer science. "MVC consists of three kinds of objects. The model is the application object, the View is its screen presentation, and the Controller defines the way the user interface reacts to user input" [1]. Combining the view and controller objects leads to the model/view architecture. The model contains the location of the source data and provides the interface to the data, all editing and retrieving of data must be done through the model. The view obtains indexes or pointers to the data, from the model, and renders the data appropriately. It is possible to create many views which render the data in the same model. All editing of the data must go through the model interface.
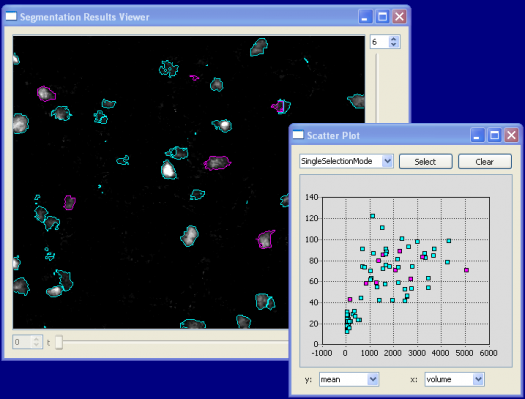
In the EVS we refer to the model/view architecture as ALISA (Actively Linked Integrated Spaces Architecture). ALISA provides multiple views of segmentation object data. These views include an overlay of the segmentation results on the raw image data (usually in the form of outlines) displayed one slice at a time, three-dimensional (3-D) renderings, table views of object features, and multiple two-dimensional scatter-plot views of the features. All views are actively linked meaning that operations performed on objects in one view are immediately visible in all other views. A subset of the edit operations is available in any one of the views. Segmentation results may be validated using group edit-based validation protocols (Validation Methods). Group edits significantly reduce the effort required to correct a segmentation result.
Group Editing
ALISA is designed to allow group editing of objects. The idea is for the user to select a group of objects based on their features. This can be done manually, or using automated pattern analysis algorithms. Manual selection of objects is aided by scatter plots of features. The user can choose the features displayed along the x and y axes of scatter plots. To visualize more than 2 features at a time, ALISA allows the user to display an unlimited number of scatter plots. Each point on the scatter plot corresponds to a specific object in the image (with a unique identifier (ID)). Clicking the mouse on a point selects and highlights the corresponding object in all other views. The user can also draw a polygon on a scatter plot to select a group of objects visually.
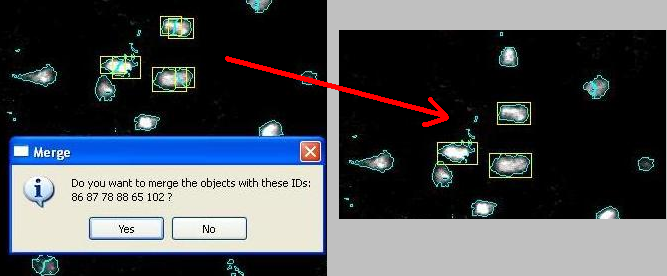
Computer-assisted selection of objects can also be performed. Features that highlight specific types of errors in segmentation (we call them diagnostic features) can also be defined and these objects selected and edited in their feature-space. Outlier detection tools are provided to assist in finding unusual objects to be inspected and/or edited. Outliers may correspond to segmentation errors (typical) or unusual cells (rare but possible). For outlier detection, the one-class Support Vector Machine (SVM) is employed [libSVM]. The one-class SVM proves to be a very useful tool for outlier detection, often highlighting a variety of quirky objects that should be inspected more closely, and edited when necessary. The outliers are shown in the segmentation, and scatter views, by a simple color coding scheme. The user can quickly locate, inspect and edit the outliers due to the linked nature of the views. The simplicity of this idea is illustrated below.
Editing Tools for Other Object Classes
The above examples have largely focused on blob-shaped objects (cell nuclei). However, the idea of edit-based validation is applicable to all other object types. Visit the [Trace Editor] page for information on inspecting and editing automated tracing of tube-like structures (neurite processes, vessels, etc.). The same methodology also extends for inspection and editing of automated cell tracking results.
For Developers
References
[1] Gamma E, Helm R, Johnson R, and Vlissides, JM, (1994) "Design Patterns: Elements of Reusable Object-Oriented Software" Addison-Wesley.


