Microglia Tracing Tutorial
Contents |
Details
- Goal: This tutorial will show you how to use FARSIGHT tools to generate centerline traces of microglia processes.
- Duration: 15 minutes (depending on processing power)
- Prerequisites: FARSIGHT v0.4.4 (or later) installed, python installed.
In this tutorial we will be working with a small example image titled C1-1unmixed-crop.tif. This is included in your FARSIGHT installation within the data directory. If you'd prefer to do so you can perform this tutorial using another 3D image of microglia.
Overview
This microglia segmentation procedure is divided into two steps. First, we isolate the somata, or cell bodies, of the microglia depicted in the input image. One of the outputs that we obtain from the soma segmentation procedure is a list of the centroids of the somata. These centroids serve as seed points for our second step: microglia process tracing. The output of process tracing is a .swc file.
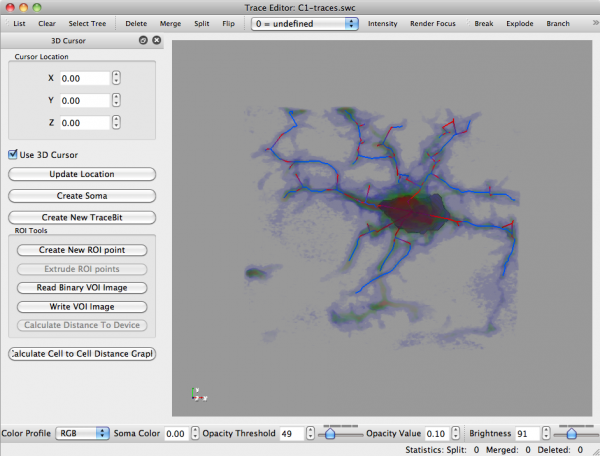
Once tracing is complete we can view, validate, and edit our results using the FARSIGHT Trace Editor.
Some Words about Image Spacing
The segmentation tools presented in this tutorial have been designed to use information about the input image's spacing. This allows our tools to achieve useful results regardless of the input image's magnification level. By "spacing", we refer to the amount of physical space that is represented by each voxel. Images obtained from confocal microscopes are typically anisotropic. Therefore we consider the image's X/Y spacing separately from its Z spacing.
Some image formats allow you to embed this spacing information within the image's header. In this case, our tools will automatically read & use this information. Other formats do not have this feature. If default image spacing is detected, you will be prompted to supply this information on the command-line prompt.
The segmentation tools presented here expect image spacing to be set in units of microns per pixel.
The example image C1-1unmixed-crop.tif does not have its spacing embedded inside an image header. Therefore, when prompted, you should supply the following values:
| X/Y spacing | 0.3 microns |
|---|---|
| Z spacing | 0.5 microns |
Soma Segmentation
These instructions show how to segment somata from the microglia channel. A future tutorial will focus on how to incorporate the Nucleus channel in this task.
In the instructions below, commands are isolated in boxes and preceded by $. Expected output will also be included in the box. It will be distinguished by use of italics. Unless otherwise indicated, all commands are meant to be executed from the command-line. For this tutorial, the current working directory is assumed to be the root of your FARSIGHT installation. This is the location of the following subdirectories: bin, data, lib, python.
To perform soma segmentation we use the ExtractSoma.py python script. This is located within the FARSIGHT bin/ directory. Running this script with no arguments gives us more information about how it is meant to be used:
$ bin/ExtractSomas.py

bin/ExtractSomas.py <input image> <output image> [spacingXY spacingZ]
The square brackets indicate optional parameters. We can either supply the image spacing on the command-line, or wait for the application to prompt us for this information.
The soma extraction script produces a lot of intermediate results. Therefore, let's create a new directory for our output. This will keep us from cluttering up the data directory.
$ mkdir output
Now we're ready to extract the solitary soma from our example image.
$ bin/ExtractSomas.py data/C1-1unmixed-crop.tif output/C1-soma.tif 0.3 0.5

Preprocessing input image
Reading image spacing from command-line
Input image's spacing now set to [0.3, 0.3, 0.5]
Separating image foreground from background
Eroding away microglia processes
Isolating somata
minimum volume required to be considered a soma: 75
Before pruning, I count 1 distinct somas.
Blob #1 has a volume of 382.5
I count 1 distinct somas.
		(min	avg	max)
Elongation	1.73439	1.73439	1.73439
Flatness	1.26948	1.26948	1.26948
Radius		4.50313	4.50313	4.50313
Size		382	382	382
The ExtractSomas.py script is well-documented. By examining this file in a .txt editor you should be able to gain a greater understanding of the numerical parameters that are used in this procedure.
Process Tracing
The tool we use for this step is aptly named MicrogliaProcessTracer. As before, it can be found within the bin/ subdirectory of your FARSIGHT installation. Again, we can run this command-line executable with no arguments to see what input it expects:
$ bin/MicrogliaProcessTracer

bin/MicrogliaProcessTracer input-image seedfile.txt soma-image distance-threshold output.swc [spacingXY spacingZ]
The only numerical parameter here is the distance threshold. This determines how far apart (in microns) two connect "interest points" can be. A good default value for this parameter is 3 microns.
$ bin/MicrogliaProcessTracer data/C1-1unmixed-crop.tif output/soma-centroids.txt output/C1-soma.tif 3
    output/C1-traces.swc 0.3 0.5

Loading the input image
Reading input file data/C1-1unmixed-crop.tif
Input image's spacing now set to [0.3, 0.3, 0.5]
Input file size (after zero padding) is [190, 168, 24]
Reading the start points
Reading the soma image
Distance Threshold: 3
Beginning Tracing

Searching for critical points
Analysis at sigma 1
Number of CTs at this stage: 1012
Analysis at sigma 1.18921
Number of CTs at this stage: 261
Analysis at sigma 1.41421
Number of CTs at this stage: 148
Analysis at sigma 1.68179
Number of CTs at this stage: 48
Analysis at sigma 2
Number of CTs at this stage: 9
Analysis at sigma 2.37841
Number of CTs at this stage: 4
open list size: 334
closed list size: 1
computing adjacency matrix for seed points
computing adjacency matrix for critical points
25 nodes were too far away to get added to a cell model
cleaning up nodes that fall within a soma
writing output to disk
Total time to segmentation is : 3.04034
Post-Segmentation Analysis
main article: Trace Editor
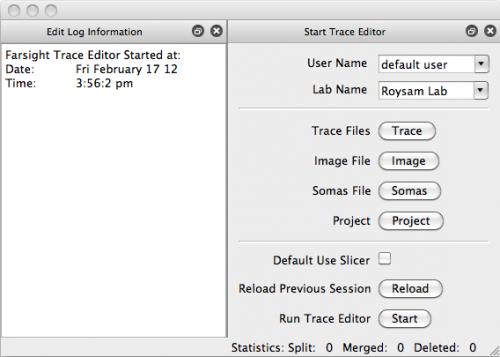
Now that we've successfully traced an image of microglia, open up TraceEdit. On Mac OSX this can be found in the root of your FARSIGHT installation as TraceEdit.app; all other platforms will find the executable within the bin/ subdirectory. You will be greeted with the following welcome dialog:
This is where we load our data into the Editor.
- Click Trace and select output/C1-traces.swc
- Click Image and select data/C1-1unmixed-crop.tif
- Click Somas and select output/C1-soma.tif
- Click Start
You can gain more analytical information about these results by accessing the following menu options:
- Analysis -> Cell Analysis
- Analysis -> Show Plots
Please see Trace Editor for more information about this tool and its capabilities.

