Object level association
In this page we give an overview of the distance-based approach for defining object-level associations, instructions on how to run the association program and sample input and output XML files
Contents |
Overview
We present a simple, yet general framework for object-level association between biological objects and/or elements present in the different channels of multi-channel images. The proposed object-level association framework assumes that any association rule is defined between two elements. The first one, which we call the reference element, is the segmented object (such as cells/nuclei) for which we want to quantify some associative relationships. The second element, which we call the target element, is a biologically meaningful element in a different channel. The target element does not have to be segmented or undergone under any kind of processing.
Two association examples are shown in Figure 1 below. In both examples, the reference element is a segmented cell nucleus. However, the target element in the first example (panel A) is a segmented blood vessel. Hence, association occurs between two segmented objects. In the second example (panel B), the target element is a molecular signal (yellow) that may surround some cell nuclei and available in a different channel.

An association rule is composed of two components. The first one defines the region of interest (ROI) associated with the reference elements and on which the associative measure is applied. The second component is an associative measure, which is a mathematical function defined on the regions of interest (ROI) of the reference elements, and used to quantify the associative relationship.
Defining The Region Of Interest
The region of interest (ROI) corresponding to an associative rule is defined using a distance function. Starting from the edge points (segmentation boundary) 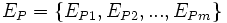 of the reference element E, the distance function DE(x,y) computes the shortest signed Euclidean distance from a point (x,y) (or (x,y,z) in 3-D images) to the boundary points of the reference element:
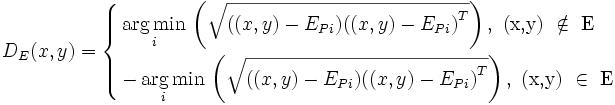 where i = 1,2,...,m
Based on this distance function, the region of interest (ROI) is defined as a region with specific inside and outside (respectively negative and positive) distances. For example,  is the region of interest (ROI) that includes points inside the reference object with distances up to 5 pixels/voxels from the its boundary and points outside the reference object with distances up to 5 pixels/voxels from its boundary. As another example,
 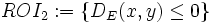 represents all the area enclosed by the object boundary.
Defining The Associative Measure
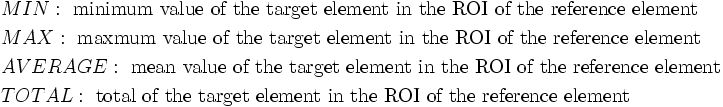
As mentioned above, the associative measure is a mathematical function defined on the ROI of the reference element and used to quantify the association between the reference and the target elements. We represent the associative measure as a function that takes two input arguments ψROI(C,OP). The first one (C) is the target image (channel), and the second one (OP) refers to a mathematical operation to be used to quantify the association. Seeking simplicity and generality, our proposed associative measure can use any of the following different four operations:
Let the target element be present in image channel Ci, and let p be a point (2-D or 3-D) in Ci, then, the associative measure is defined as follows:
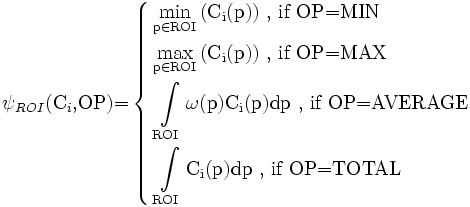
where ω(.) is a weighting function that is uniformly distributed over ROI.
Running The Program
A stand-alone executable for computing object-level association measurements is available in farsight. The program runs in two modes. In the first one, an XML file containing associative rules definitions is provided. In the second one, the rules are defined one by one using the command line. At the end, an XML definition file will be automatically generated. In both cases (modes) the computed associative measuerments will be saved into an XML output file.
1-associative rules defintion file is available
If an XML definition file is provided, it will be the only required input argument
Usage:
compute_associative_measures.exe <AssocDefinitionXMLFileName>
The XML file defines one or more associative rules on the same source channel (containing the source elements). Each rule definition must include the target channel, definition of the region of interest (ROI) and the mathematical operation used to quantify the association. For example, the XML document below defines two associative rules using the segmentation output of channel1 as the source and two other channels for each of the associative rules. The regions of interest are the same as those two examples provided in the previous section: and .
Finally, the two rules use the AVERAGE and the TOTAL associative measures, respectively.
<ObjectAssociationRules SegmentationSource="channel1_segmentation.tif" NumberOfAssociativeMeasures="2">
      <AssociationRule Name="Rule1" Target_Image="channel2.tif" Outside_Distance="5" Inside_Distance="5"
       Use_Whole_Object="False" Association_Type="AVERAGE" />
      <AssociationRule Name="Rule2" Target_Image="channel3.tif" Outside_Distance="0" Inside_Distance="0"
       Use_Whole_Object="True" Association_Type="TOTAL" />
</ObjectAssociationRules>
2-no defition file is available
If no XML definition is availabe, the user has to define the associative rules one by one.
Usage:
compute_associative_measures.exe <SegmentationResultsFileName> <AssocDefinitionXMLFileName> <NumberOfAssociationRule>
The first input is the name of the segmentation output file name that contains the source elements. The second argument is the name of XML file into which the user-defined associative rules will be saved for future use. The last argument is the number of associative rules that need to be defined. For example, the next screen shot shows the steps needed to creat the above XML file using the command line:

Sample Input/Output XML files
Screen shot of a rules definition XML file: (click here[[1]])
![[1]](http://www.farsight-toolkit.org/mw/images/5/5c/XML_sc1.jpg)
Screen shot of an output XML file: (click here[[2]])
![[2]](http://www.farsight-toolkit.org/mw/images/9/98/XML_sc2.jpg)