NucleusEditor
The main purpose of the NucleusEditor program is to view and segment images of nuclei, and then efficiently edit the segmentation using pattern analysis tools (PACE). An auxiliary function of the system includes segmentation of 2D Histopathology images.
Contents |
Image Viewer
NucleusEditor allows users to view image data in a variety of file formats (tif, pic, lsm, etc). The image must be in 8-bit grayscale and must have "bright" foreground objects under a "dark" background to segment properly. An image may be opened by selecting File/Load Image...

XML Images
Often multi-channel images are divided into multiple files; one file for each channel. We have defined an XML file format for specifying this type of image. Each file can be given a channel name and a channel color.

Segment Cell Nuclei
To begin segmentation, an image must already be loaded and visible in NucleusEditor. The nuclear segmentation algorithm is triggered by selecting Tools / Segment Nuclei... The program will use the visible image for the segmentation algorithm, and ask the user to select the desired channel from within that image. Before the segmentation algorithm can begin it must be initialized with a few parameters. These parameters will be chosen automatically using an innovative algorithm developed by Yousef Al-Kofahi. When the segmentation begins, an activity toolbar will be added to the NucleusEditor that shows the progress of the segmentation algorithm and provides a STOP button to cancel the segmentation.
Nuclear Segmentation is achieved in 2 major steps:
- 1. Segmentation
- 2. Editing

Upon completion of the segmentation, the program will compute features and show this metadata (mainly object features) using multiple data visualization tools that are all actively linked, allowing the data to be viewed in multiple spaces simultaneously. There is a method to select a cluster of objects based on any combination of operations in any of the multiple spaces. We term this method actively linked multiple spaces architecture (ALISA). NucleusEditor provides this linked-view architecture where objects can be visualized in image or geometric views, table views, plot views, and histogram views. Operations performed in one view are immediately visible in all of the views.
In the ALISA mode a number of operations become active in each view:
- Segmentation Result
- Show/Hide Object Boundaries (View|Show Boundaries or Ctrl+B)
- Show/Hide Object ID Numbers (View|Show Object IDs or Ctrl+I)
- Show/Hide Object Centroids (View|Show Object Centroids)
- Add Table (View|New Table)
- Add Scatter Plot (View|New Scatter)
- Add Histogram (View|New Histogram)
- Modify gray-scale image intensity (View|Adjust Image Intensity or Ctrl+G)
- Clear Selections (Editing|Clear Selections or Ctrl+C)
- Edit Functions (Edit Menu - see below)
- Apply an Exclusion Margin to the image (Editing|Apply Exclusion Margin...)
- Zoom using + and - keys
- Select/Deselect Objects (Hold Ctrl key to select more than one object)
- Scatter Plots
- Select/Deselect Objects
- Select/deselect by clicking on single object
- Clear all selections (Options|Clear Selections or Ctrl+C)
- Select a group of objects by holding down the SHIFT key, and clicking on a series of points to sketch out a polygon that acts as a "lasso".
- Options|Normalize - Ctrl+N (show features in normalized space)
- Tools|Find Outliers (ALISA - see below)
- Options (can change columns for X,Y and coloring)
- Select/Deselect Objects
- Table
- View|Filter table by... (To select items meeting specific criteria)
- Show/Hide table columns (View|Visible Columns)

Image Processing Pipeline
In many cases the automatic nuclear segmentation parameters will require modifications for satisfactory results. This is possible by using the project processor capability within the Nucleus Editor. This function uses an XML definition file as input. This definition file can specify required process steps and parameters for each step. For example, it can be used to limit the number of features that are calculated and specify that certain associative features are desired. See an example of one of these files below. If you have specific needs please contact the Roysam lab for assistance in creating a process file. Once the file has been created, execute the pipeline by first loading the image, then choosing "File|Process image..."

Using the PACE Concept
Since automated segmentation algorithms are not perfect, there is a compelling need to develop efficient methods to identify and correct the automated segmentation errors. Due to the large size of the datasets, the identification and correction of the cells to be edited have to be done very fast. In order to achieve this, NucleusEditor implements kernel based pattern analysis algorithms where we can do group or cluster editing of multiple errors simultaneously. This dramatically reduces the amount of manual effort required compared to unassisted edit-based methods. We term this methodology PACE (Pattern Assisted Cluster Editing). By observing the nature of the errors, it will be possible to asses the performance of the segmentation algorithm used in NucleusEditor and modify it to reduce similar errors in the future.
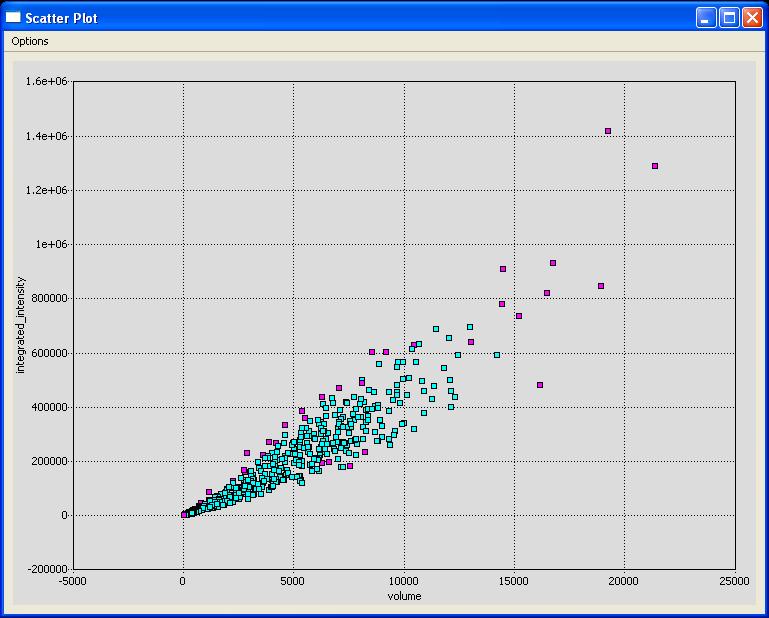
ALISA is designed to allow group editing of objects. The idea is for the user to select a group of objects based on their features. This can be done manually, or using automated pattern analysis algorithms. Manual selection of objects is aided by scatter plots of features. The user can choose the features displayed along the x and y axes of scatter plots. To visualize more than 2 features at a time, ALISA allows the user to display an unlimited number of scatter plots. Each point on the scatter plot corresponds to a specific object in the image (with a unique identifier (ID)). Clicking the mouse on a point selects and highlights the corresponding object in all other views. The user can also draw a polygon on a scatter plot to select a group of objects visually.
Computer-assisted selection of objects can also be performed. Features that highlight specific types of errors in segmentation (we call them diagnostic features) can also be defined and these objects selected and edited in their feature-space. Outlier detection tools are provided to assist in finding unusual objects to be inspected and/or edited. Outliers may correspond to segmentation errors (typical) or unusual cells (rare but possible). For outlier detection, the one-class Support Vector Machine (SVM) is employed [libSVM]. The one-class SVM proves to be a very useful tool for outlier detection, often highlighting a variety of quirky objects that should be inspected more closely, and edited when necessary. The outliers are shown in the segmentation, and scatter views, by a simple color coding scheme. The user can quickly locate, inspect and edit the outliers due to the linked nature of the views.
Clues
Two simple features have been shown to be particularly useful in detecting segmentation errors: volume and percent shared boundary. The following edit operations tend to correlate to these features in this way:
- Delete: small volume & zero (or small) percent shared boundary
- Merge: small volume & large percent shared boundary
- Split: high volume &| high surface area
Methods
Two main techniques can be used to locate objects that need to be edited: filters and outlier detection.
- Filters: The table view provides two very useful functions: View|Visible Columns and View|Filters. The NucleusEditor provides a large wealth of feature data, most of which is noise to the editing process. Change the Visible Columns to only include those features that are useful while editing (ex. id, volume, shared boundary, surface area). Next we may want to select all of the objects with very small volume. On the scatter plot it is very hard to select just one of these objects and view it because they are too tightly clustered together. By filtering the table by volume, it becomes very easy to find all of the objects with small volumes.
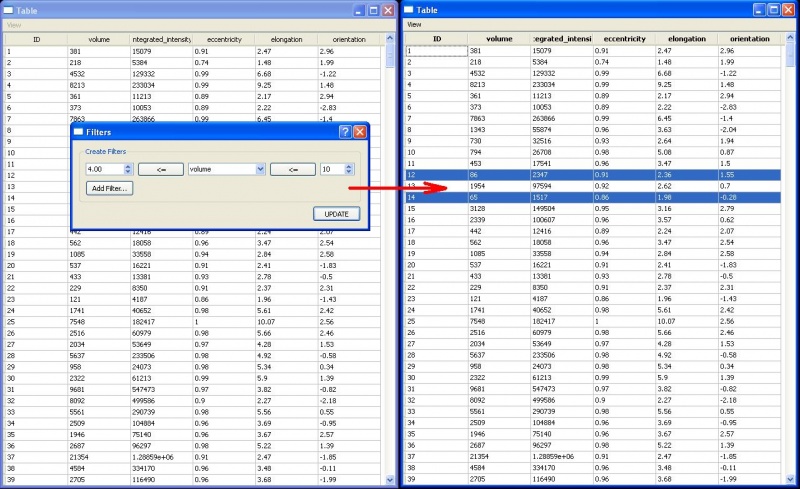 Filtering

- Finding Outliers: The Nucleus Editor provides a tool for finding outliers in a set of data. This tool can be activated by selecting Tools|Detect Outliers. The outlier tool uses the one-class SVM to find outliers. The outlier tool seems to be most effective when only 2 or 3 features are used. If the outliers are not immediately color-coded in the scatter plot it could be because the incorrect column for coloring is selected, please select the "outlier?" column by choosing Options|Set Color Column. From the scatter plot it is now easy to find sub-populations of objects that meet specific criteria (ex. small volume & high shared boundary - possible merge candidates).
 Finding Outliers

Edits
At this stage in the process sub-populations of objects requiring specific edits should be identified, either by sorting the table or by finding regions (outliers) in the scatter plot. NucleusEditor provides the following three operations to edit cells, which will become active when a valid segmentation result is loaded:
- Delete
- Merge
- Split
- Add
- Fill
The goal is to implement these operations using smart algorithms that allow them to be carried out in groups. These "smart algorithms" are still in development. The idea is to identify a large group of objects that need to be merged (for example), and simply tell the program to merge them. This could mean merging some of the selected objects with other selected objects, or it could mean merging a selected object with another, non-selected, object. Similarly, the split function should attempt to split an object into the most optimal number of objects with reasonable boundaries. As soon as objects are edited all views will be updated (however you will need to re-run the outlier detector to update outliers). Be sure to select File|Save Result to save results and any edits that have been performed.
Add
Adding new object requires detecting new foreground pixels from the existing background. Start the add operation by selected "Editing|Add Objects" from the menu or by "Ctrl+A". Draw a box around the new object in the middle z-slice of that object by clicking the left mouse button.
Delete
In order to delete objects we simply select them in any one of the available views and choose the "Editing|Delete Objects" menu item within the Nuclear Segmentation Window or by "Ctrl+D". In the following example all cells with small volume and zero shared boundary will be deleted, they have first been selected in the table view.
Merge
Merging objects requires the selection of two or more objects. Only neighboring objects will be merged to form a new object. Merging may be initiated from the "Editing|Merge Cells" menu item or by "Ctrl+M". Note that if the selected cells are not neighbors, they will not be merged. In this example we have merged object 394 and 396 to become a new object: 504.
Split
Splitting objects is achieved by specifying two or more seed points. Start the splitting operation by selecting "Editing|Split Objects X-Y" from the menus. Left-click within the objects to place 2 seed points. Objects will be split as soon as two seed points have been specified. Choose "Editing|Split Objects X-Y" again from the menu to exit splitting mode.
Objects may also also be split at a specific z-plane. This is accomplished by Choosing "Editing|Split Objects At Z. All selected objects will be split at the current z slice.
Fill
Sometimes segmented objects can be made of up multiple (non-touching) connected components, or they may have holes in them. These errors can be fixed using the "Edit|Fill Objects" menu item.
Edit History Log
When edits are made to a nuclear segmentation, an entry is made to a log file. This log file is stored in the same location as the input image.
Save/Load Results
A segmentation has multiple components, each can be saved separately or as a complete project.
Image: This is the input image. It may be important to save this if preprocessing.
Result: This is the result image.  It is stored as a label image
Table: This is the information that is in the table (features).
Project: Creates a project file (XML) that contains the filenames of all of the project files, including the ones named above.
A convenience function is also available for saving the currently displayed image (image + result + boundaries + ids + centroids + etc). The image saved is 2D.
KPLS Classifier
After the image has been segmented and the edits have been made, the KPLS classifier can be used to classify the cells in the image. For classifying the cells, the user needs to provide a reliable set of training samples. This can be done through the following actions
Train
In order to train the classifier we select the "Train" Option under Tools->Classifer menu. this opens the Training Dialog. We can either save the set of training samples ( called the model) or simply specify the sample IDs for the number of classes present and test the classifier's performance for this training set.

Training Set : We can enter the IDs that best represent each class. Clicking the Add Class button adds another row to the dialog where the ids for the next class can be entered. Clicking the Remove Class button removes the last class added and any ids entered for the class. After all the IDs have been added for the classes, we click the Done button to complete the training.
Note: The IDs can be overlayed onto the nuclei by selecting the Show Object Centroids item in the View menu.

We can also save the set of training samples as a model to reuse it for similar images. Clicking the Save Model opens a pop up and we can save the model as an XML file in the location of our preference. The Training Dialog box will close automatically after the model is saved.
Training by Loading a Model: We can also train the classifier by loading a model. This can be done in the Training Dialog by clicking the Load Model. This opens a popup which can be used to select the file containing the model which was previously saved. We need to make sure that this model is applicable to the image currently being processed. The Training Dialog box will close automatically after the model is loaded.
After the training process, an additional column called train is added to the table. All the IDs which have not been used for training will have the value -1 for this column and the IDs used for training will have the respective class value.
Classify
In order to classify the objects we select the "Classify" Option under Tools->Classifier menu. This opens the Pattern Analysis Wizard. We can select the set of features that we want to be used to classify the objects from the menu.

Clicking Finish will classify the objects in the image . After the training process, an additional column called "prediction" is added to the table. This column will contain the prediction made by the KPLS classifier based on the features selected for classification.
To visualize the classification results from the image displayed, we can select the View Object Centroids from the view menu after the classification. This displays the centroids of different classes in different colors.
Keyboard Shortcuts
Ctrl+L Load Project
Ctrl+S Save Project
Ctrl+Q Quit
Ctrl+B: Hide/show Boundaries
Ctrl+I: Hide/Show Object IDs
Ctrl+C: Clear Selections
Ctrl+A: Add Object (trigger command, then draw a box)
Ctrl+M: Merge Objects (all selected objects will be merged selected neighbors)
Ctrl+D: Delete Objects (removes all selected objects)
Ctrl+F: Fill Objects
Ctrl+T: Split Objects in Z direction at current Z
Ctrl+P: Split X-Y (Select this, then click two points as seeds).
-/_  zoom out
=/+ zoom in
Use the number keys to show/hide channels (starting with 0)
Summary
An "edited" segmentation is also a "validated" segmentation, and the results can be used for hypothesis-driven research utilizing object features, associative object measurements, and the other tools that are part of the FARSIGHT Toolkit.
See the "getting there" page for a suggested editing/validation procedure.
Contributors to the Nucleus Editor:
- Isaac Abbott
- Yousef Al-Kofahi
- Aytekin Vargun
- Raghav Padmanabhan
This page was prepared by Isaac Abbott & Aytekin Vargun