Trace Editor
Audreys247 (Talk | contribs) (→Extrude ROI point:) |
Audreys247 (Talk | contribs) (→Read Binary VOI Image:) |
||
| Line 291: | Line 291: | ||
===='''Read Binary VOI Image:'''==== | ===='''Read Binary VOI Image:'''==== | ||
| − | Opens a binary image. (.vtp) | + | Opens a binary VOI image. (.vtp) |
===='''Write VOI Image:'''==== | ===='''Write VOI Image:'''==== | ||
Revision as of 21:28, 10 September 2012
The FARSIGHT trace editor is designed for:
- detailed visualization of reconstructions
- rapid identification of tracing errors
- rapid and minimal-effort correction of errors using interactive graphical tools
Our motivation for this project was to increase the speed of performing edits on automated reconstructions. Even the best automated systems today have a non-zero error rate, implying the need for visual proofreading and corrective editing systems. However, previous work could only perform one edit operation at a time. This limitation increases time and manpower to perform edits, especially when there is a deficiency in the automated reconstruction, or when the data volume is high.
Our approach to overcome this limitation is based on the idea of pattern analysis aided cluster editing (PACE). The idea is to utilize quantitative measurements (features) of automated tracing results, and multivariate pattern analysis tools, as appropriate, to identify groups (clusters) of image sites where a common type of tracing error has occurred and correct all of the identified sites at once by the software system. See References for more information.
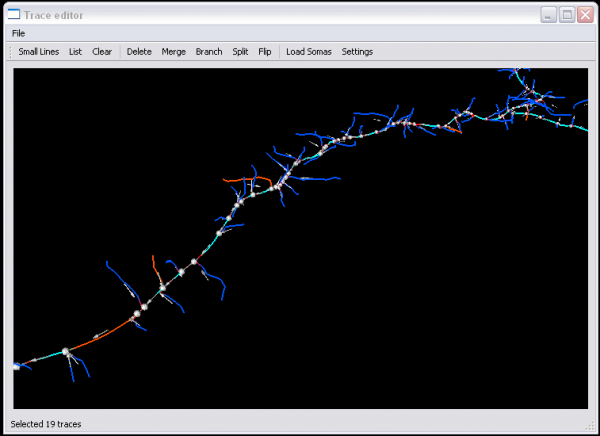
The FARSIGHT 3-D Trace Editor
From a biological image, tubular objects such as blood vessels and neurites can be represented by a series of cylinders. The centerlines of the cylinders can be represented by a series of 3-D points. By providing information about the connections between points, the tree structure can be traced and stored in a data structure. The FARSIGHT 3-D Trace Editor is designed to
- provide a streamlined platform for multi-view visualization and
- Edit-based Validation System (EVS) of automatic neurite and vessel tracing algorithms.
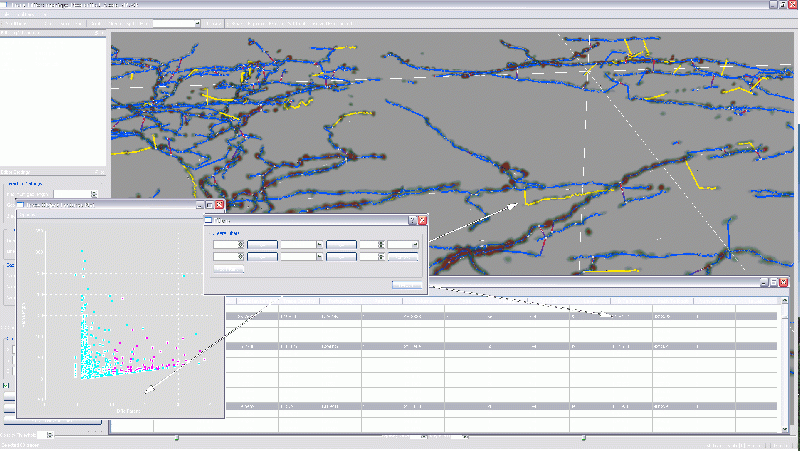
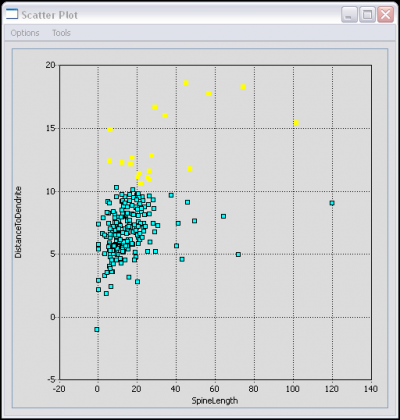
The Actively Linked Integrated Spaces Architecture (ALISA) manipulates multiple views and allows for the simplification of the display and subset selection of data, such as a 3D rendering, tables, or scatter plots. Group and automated editing of the trace structure is possible using ALISA, as pattern analysis and clustering can aid in selection. The primary view in the editor is the 3D rendering which has the capability to display the traces as color coded lines with an overlay of a volume rendering from original image. Rendering can be viewed from any angle and at any desired magnification. The secondary display is the linked space where computed features can be displayed simultaneously in table and scatter plot form. The table and plot views can filter and sort the features by simplifying selections, which are automatically updated in all views. Group and automated functions provide an efficient method for validating complex data sets.
Since the traces are represented as a sequence of points in 3-D space, they have a sense (directionality). Many automatic tracing algorithms produce a collection of trace fragments (segments) that don't have a consistent set of directions (sense). The trace editor is designed to cope with this challenge. It is also designed to allow "group editing". Using the linked space, you can select multiple segments at once, and perform an edit operation over the selected set of segments.
The Trace Editor allows use of multiple linked spaces for different 'levels' of operations. The Merge operation has its own object type to characterize gaps between trace lines; this linked space is only active and visible when you are working on the merge operations.
Getting Started:
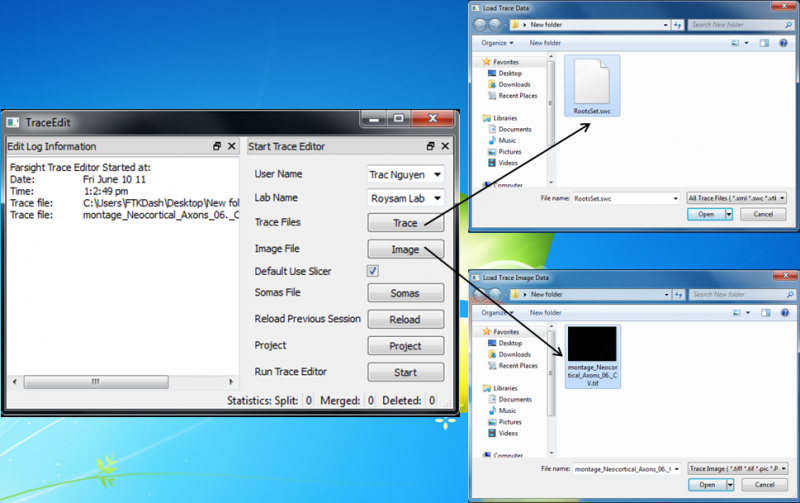
When you double click on the Trace Editor icon or launch the TraceEdit executable, a dialog will appear asking for user information and initial files to open. The files include an acceptable tracing format and an image. Trace Editor can load additional files through the file menu while running. There are two rendering options for the input images: a raycaster and a contour filter. The Raycaster is used for a more detailed image such as the initial image. The Contour Filter is used for displaying segmented images, such as somas, as a volume. Currently, Trace Editor accepts the following file types as input:
- Trace Files:
- .swc
- xml (RPI format)
- .vtk* (this is only the 3D structure)
- Image Files (8-bit gray-scale or binary for raycasting or determining soma contours):
- tif
- pic
- mhd
- Trace Project
- .xml
A Reload Previous Session button will load the files used the last time the application was launched.
Basic Usage
- Navigate 3D Space
RMB=Right Mouse Button
LMB=Left Mouse Button
MMB=Middle Mouse Button (scroll wheel if you have one)
*Important:
If you load a .vtk file you must set all necessary root nodes of the trees before you do ANY other operations for branching to work.
This is necessary because A .swc file already has direction information but the .vtk file is an unordered graph.
Select your traces and use the 'Set Root' button or hot key 'R'
- Rotating View
- hold LMB while dragging
- hold ctrl + LMB for spin
- Pan/Scroll
- hold MMB while dragging
- hold shift+ LMB (this is required on Macs and most laptops)
- Zoom
- hold RMB while dragging
- scroll MMB
- Selections
- Select a trace
- 3D view: RMB click on the line (note: a 3D cursor will appear if enabled)
- Linked space plots: LMB click (to make a group selection, hold shift and multiple clicks to make a lasso outline)
- Select a trace
- Picking a point in 3D
- A 3D cursor will be used in the main window to mark where you selected
- Enable the 3D Cursor dock from the toolbar menu for readout of coordinates and tool options
- The cursor can be moved by:
- Typing in a new coordinate into the fields in the 3D Cursor dock
- Drag the cross-hairs to a new location (press update location if you dragged it)
- To move only along one axis (x, y, or z) hold shift while dragging cross-hairs
Trace Project
The Trace Project is a .xml document that tells the trace editor where to find multiple input files. The Project file loads information such as file type, and translation coordinates to tile multiple files into a montage. The following code is an example of an image translated so that it registers to the trace loaded.
 <?xml version="1.0" ?>
 <Source>
  <File FileName="C:\Lab\Traces\NC\Neocortical_Axons_01.tif" Type="Image" tX="73" tY="507" tZ="-5"/>
  <File FileName="C:\Lab\Traces\NC\NC_01.swc" Type="Trace" tX="0" tY="0" tZ="0"/>
 </Source>
Trace Editor will search in the folder the project file is in and load as many of the files as it can find
- Some Information on the project file
- File Name:
- If know you can include the Path such as C:\Lab\Traces\NC\
- For portability between computers just use the filename
- Type:
- "Image" Original Image Data
- "Soma" Segmented Image of the Cell Body
- "Trace" Any Valid Trace File
- tX, tY, Tz,
- Values of the transform to be applied along the respective axis
- File Name:
Basic View
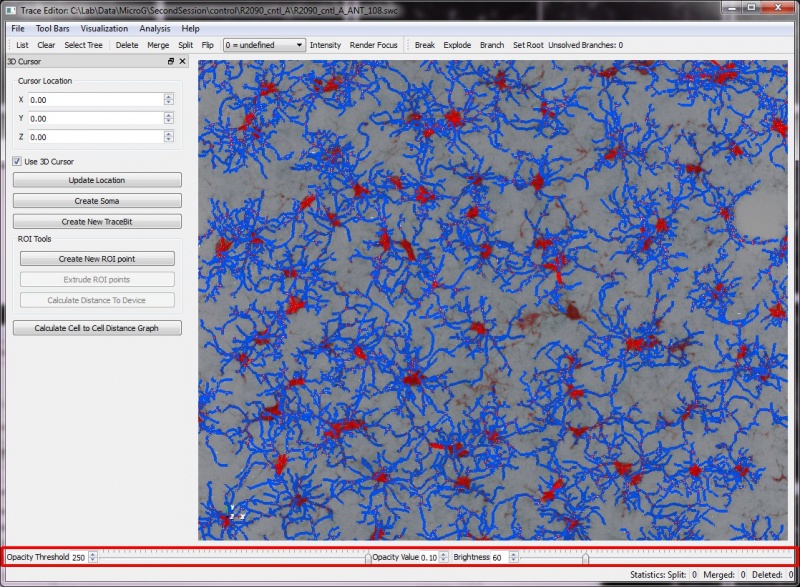
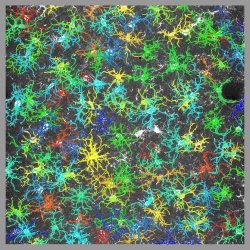
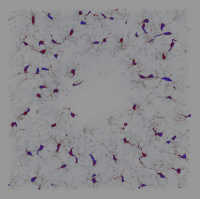
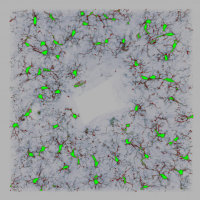
The results can show the Traces displayed as lines, and the original image as a 3D volume with adjustable brightness and opacity. This allows for validation of the traces, and a more intuitive way to visualize the data than 2D slices or table formats. In addition to display of the original image, the Trace Editor can also display segmented soma images. This data is also rendered in 3D and then overlaid on the traces. Rendering the somas along with the traces allows for more accurate validation. The increased accuracy enables greater ease in associating processes with the proper soma and also in correcting and validating the directionality of the processes.
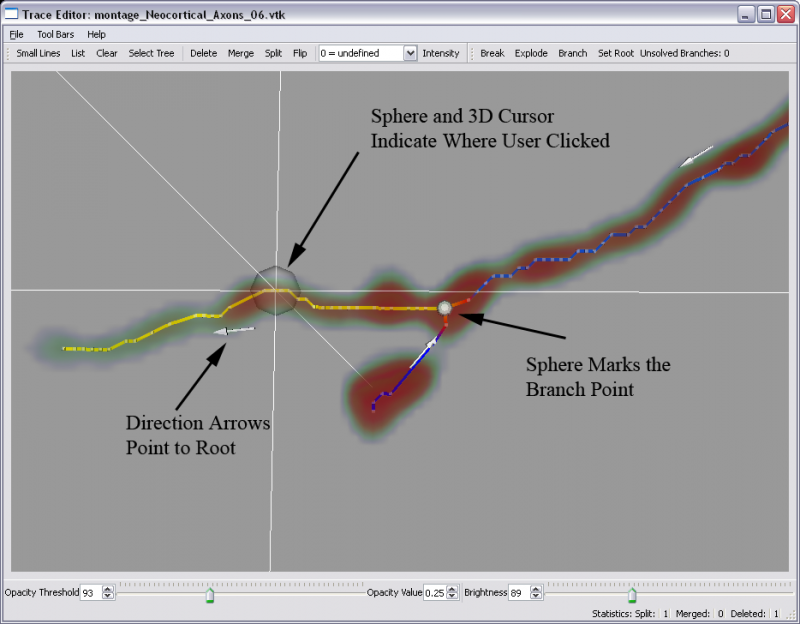
Note: The Trace Editor uses VTK to present the images, which orders image indices in memory for the Y-direction differently than on disk, according to computer graphics convention. As a result, the image may appear flipped it the Y-direction relative to other visualization applications that do not use this convention.
Cell Analysis Tools
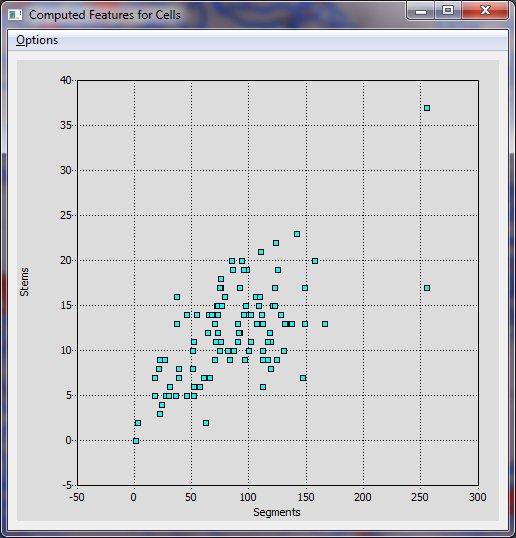
The Cell Analysis is a reimplemented version of the L-Measure toolkit. The Cell Analysis allows comparison of cells based on cellular morphology features. Selecting a row of the cell features linked space highlights all corresponding trace segments.
Editing Tools
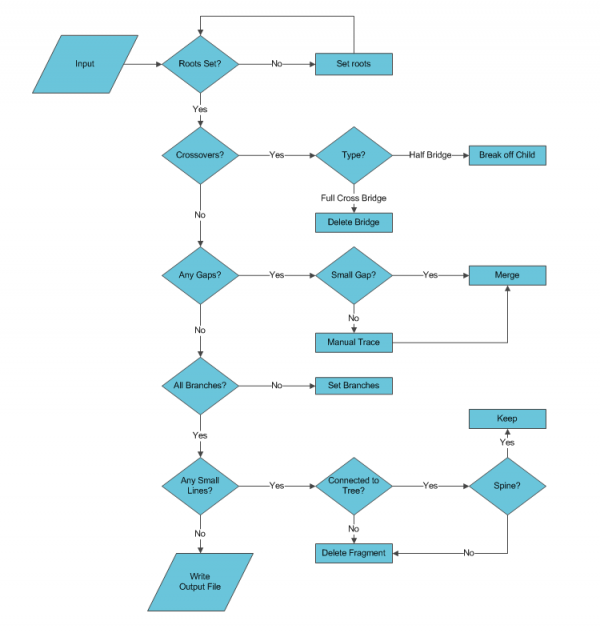
Once the Trace Editor has successfully launched, the render window will have interactive 3-D viewing and editing capabilities. Several operations have automated and semi-automated functionality depending upon the input. For manual selective editing, you can point the computer mouse and highlight a series trace segments of by right clicking them(shown by selectable color). The editing operations are grouped by functions in the following categories of selection, modification, and settings.
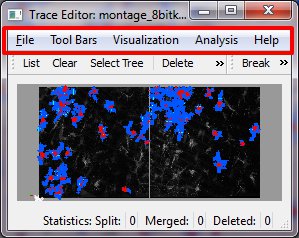
Menu Bar
- Load Traces
- Load Image
- Load Cell Trace Table
- Load Somas
- Load Nuclei Table
- Load Seed Point glyphs
- Save as
- Save Computed Cell Features Table
- Save Selected Trees
- Screen Shot
- Export Cells
- Remove Image Actors
- Edit
- Edit Toolbar
- 3D Cursor
- Segment Vessels
- Branch Toolbar
- Automated Edits
- Project Image Files
- Editor Settings
- Renderer Mode
- Soma Mode
- Color by Trees
- Grid Lines
- RayCast Tools
- Edit Log Information
- Show Statistics Toolbar
- Show Plots
- Calculate
- Start Active Learning
- Associate Nuclei to Cells
- SPD Analysis
- Clusclus Analysis
1 File Menu
Load Traces:
Opens Valid tracing .swc, .vtk, or .xml files.
Load Image:
Opens Image into a ray-caster to visualize the original data. (.tif, .tiff, .pic, .mhd)
Load Cell Trace Table:
Opens TXT file containing the computed features for cells. (Related to "Cell Analysis" found under Analysis Menu).
Load Somas:
Opens a 3D Image into the contour rendering. Works best with segmented images. (.tif, .tiff, .pic, .mhd)
Load Nuclei Table:
Opens TXT file...
Load Seed Point glyphs:
Opens TXT file...
Save As:
Saves all current Traces into a single .swc or .vtk file.
Save Computed Cell Features Table:
Saves the Computed Cell Features Table into a single .txt file.
Save Selected Tree:
Saves entire tree structures selected into a .swc or .vtk file.
Screen Shot:
Saves current screen output into a .jpg or .jpeg file and allows you to select an output resolution.
Cell Export:
Saves selected cells into separate .swc and/or .jpg files.
Remove Image Actors:
Removes images but leaves the traces if there are traces.
2 Tool Bars
Edit Toolbar
Selection Operations
This set of tools is for controlling which traces are modified. The Selections are highlighted in the 3D Viewer window and in the appropriate plots/tables in the linked space.
Small Lines:
Selects lines based on size criteria, selecting only small lines that are not part of a tree and displaying a message box allowing for group deletion.
(Hot Key "a")
List Selection:
Displays information about the currently selected trace lines.
(Hot Key "l") (lowercase L)
Clear Selection:
Deselect all currently highlighted lines. This operation also clears Gap and clears all computations for Gaps (see Merging) and Branch Points.
(Hot Key "c")
Select Tree:
This Operation will start with all selected lines, find the root and select all connected traces.
(Hot Key "t")
Trace Modification Operations
Tools for modifying the trace structure for changing trace structure:
Delete Trace:
Removes all selected trace segments.
(Hot Key "d")
Merge Traces:
Operating in one of three modes, it will attempt to merge traces based on selection inputs. The first time pressed it will determine and save all the comparisons for selection, and on second press will merge all selected comparisons.
(Hot Key "m")
- Two Traces selected: If a merge is possible under the current tolerance it will be merged.
- Multiple Traces Selected: All probable merges will be made based on selected lines and current tolerance.
- Null Selection: If there are no currently selected lines all possible merges will be made from the entire trace structure.
Split Trace:
Split each selected trace line into two parts, separating them at the point that they were selected.
(Hot Key "s")
Flip Trace Direction:
Reverses the direction of the selected trace lines. If a leaf node of a tree is selected it is the equivalent of calling Set Root, as it will become the new root when flipped and update the rest of the tree consistently. This command will not operate on a continuing segment(one that has both a parent and children).
Trace Type:
This command resets the type of the traces selected. The Types are defined as standard for an SWC file.
- 0 = undefined
- 1 = soma
- 2 = axon
- 3 = dendrite
- 4 = apical dendrite
- 5 = fork point
- 6 = end point
- 7 = custom
Intensity:
For setting the intensity values for every Trace Bit from the loaded image. This command currently only works when one image is loaded.
Weighted Intensity:
For setting the intensity values for every Trace Bit using a circle kernel from the loaded image. This command currently only works when one image is loaded.
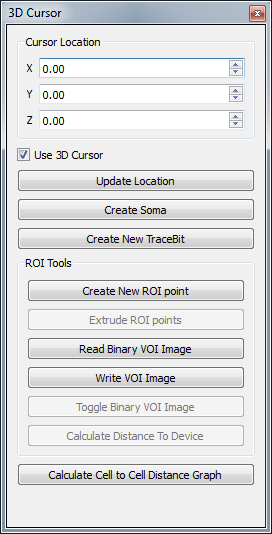
3D Cursor:
This toolbox allows coordinates to be specified in 3D space. New Trace Bits can be created at the cursor location.
Cursor Location:
Lists the 3D coordinates of the cursor last picked or specified
- The spin box can be used to precisely move the cursor
- Use 3D cursor: toggles the cross-hairs in the view if they are in the way of picking
- Update Location: Reads the coordinates of the 3D cursor
Create Soma:
Specific Create New Trace Bit function that takes two or more selected trees to attach to a new root trace that is a soma
Create New Trace Bit:
Create a new point in the trace structure
- If no traces selected it will create a new Trace Line
- If one trace is selected it will extend to either the front or back of the line (whichever is closest)
- If two or more traces are selected it will call the Create Soma function
ROI Tools
Create New ROI point:
Right-click or set 3D cursor location to locate a point and then click on this button. Select at least 3 points.
Extrude ROI point:
Create a VOI from the selected points.
Read Binary VOI Image:
Opens a binary VOI image. (.vtp)
Write VOI Image:
Saves VOI image in a .vtp file.
Toggle Binary VOI Image:
Show/hide the VOI image.
Calculate Distance To Device:
Calculates the shortest distance between the soma point and the device and outputs to the cell table.
Calculate Cell to Cell Distance Graph
Calculates the nearest neighbors and displays a graph.
Segment Vessels
In development.
Branch Toolbar
Allows user to edit on the tree level.
Break:
Removes a branch from the tree. If the resulting branch becomes a fragment it is automatically deleted.
(Hot Key "shift + b")
Explode:
This command is the 'explode' command that breaks all of the branch points connections. The connections are not lost as they are stored in a graph structure. If the set root command is called on a trace the tree will be rebuilt using the specified root.
(Hot Key "e")
Branch Point:
Adds a children to a parent trace, creating a new branch point. The tree structure will be modified to reflect the change.
(Hot Key "b")
Defines a parent as the first Trace selected and children as all following selections.
Set Root:
This will reorder the graph structure to define a root. If the tree is not already broken into a graph that will be done automatically.
(Hot Key "r")
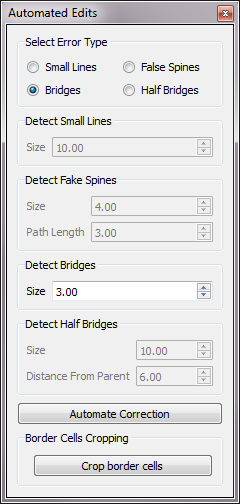
Automated Edits
Allows user to make automated edits to remove multiple errors of the same type.
Select Error Type:
Active only one at a time by selection.
- Small Lines
- False Spines
- Bridges
- Half Bridges
Detect Small Lines:
Specify the bit size of the lines.
Detect Fake Spines:
Specify the bit size and path length of the false spines.
Detect Bridges:
Specify the bit size of the bridges.
Detect Half Bridges:
Specify the bit size of the bridges and their distance from the parent.
Border Cells Cropping:
Crop border cells.
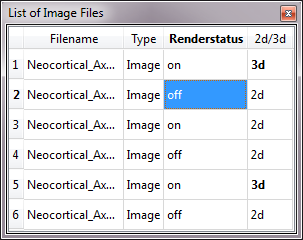
Project Image Files:
When a project file (.xml) is loaded, a table is shown that list all the images opened from the project file.
Renderstatus:
Allows for on/off switching of individual images.
2d/3d:
Allows switching between the 2D mode (projection view) and 3D mode for individual images.
RayCast Tools
Adjust opacity threshold and brightness of the image.
Soma Tools
Adjust opacity threshold and brightness of the soma. The tools are located at the bottom of the main window. (A soma file must be loaded.)
3 Visualization
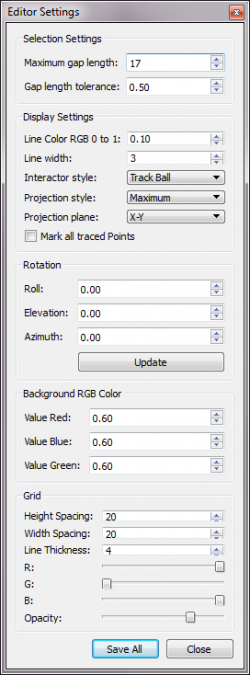
Editor Settings
Allows user to adjust defaults and global parameters. The toolbox can be opened from the menu option Visualization->Editor Settings
Selection Settings
Maximum Gap Length:
The maximum distance between endpoints allowed for merging.
Gap length tolerance:
The proportion of the length that a trace can be extended. The fraction of the length of the lines allowable for merging.
Small Line Length:
Threshold for what is considered a fragment, or small line to be deleted. Fragments are unconnected to any tree structure.
Display settings
Highlight by:
Choose the highlight mode to tree, branch order, or tips. This adjust the coloring of selected traces (right-click on traces and press 't' to highlight the tree)
Line Color RGB:
Change the highlight color for selected lines. Values range from 0-1, with reference values(R:0 - G:.5 - B:1).
Tip Color RGB:
Change the highlight color for the tips of selected trees. Values range from 0-1, with reference values(R:0 - G:.5 - B:1).
Line width:
Adjustment for the width of rendered lines to help with visibility when displaying on screen.
Interactor style:
There are four interactor style options:
- Track Ball - rotation, panning, and zooming.
- Image - panning and zooming.
- RubberBandZoom - select an area to zoom into.
- Slicer - slide through slices.
Keyboard shortcuts:
   SHIFT Left Mouse rotates the camera for oblique slicing
   SHIFT Middle Mouse slices through the image
   CTRL Right Mouse also slices through the image

   R Reset the Window/Level
   X Reset to a sagittal view
   Y Reset to a coronal view
   Z Reset to an axial view
Projection style:
There are three projection styles using raycasting:
- Maximum - show maximum values
- Mean - show average values
- Minimum - show minimum values
Projection plane:
There are three projection planes: X-Y, X-Z, Y-Z.
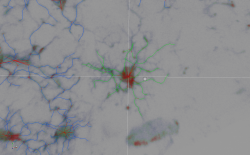
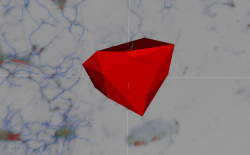
Convex hull:
The points considered for the convex hull are the terminal tips and soma point.
Ctrl+c -> select tree(s) -> check the box labeled "Convex Hull" under Editor Settings
Rotation:
Setting the three angles defines where the camera is placed in relation to the image.
- Roll - spin image
- Elevation - up-down rotate
- Azimuth - left-right rotate
Background RGB Color
Setting the three values defines what background color the render window is.
- Sample RGB colors
- (0,0,0) = black
- (.6,.6,.6) = %60 gray
- (1,1,1) = white
Grid
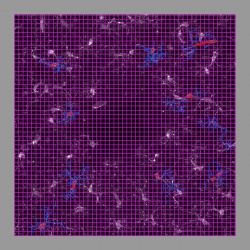
Active only when grid lines are shown through Visualization->Grid Lines.
- Width Spacing - define intervals by pixels along the x-axis
- Height Spacing - define intervals by pixels along the y-axis
- Depth Spacing - define intervals by pixels along the z-axis
- Line Thickness - define the line thickness by pixels for visibility with large images
- Adjust the scroll bar for R, G, and B to define the line color of the grid.
- Opacity - set the transparency of the line
Renderer Mode
Set Slicer
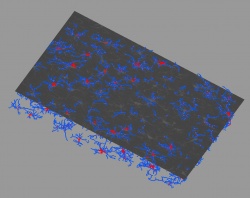
(2D mode) View individual slices of a 3-D image. The slider bar allows for the selection of a specific slice, and below the slider bar is a spinbox that sets the slice thickness (multiple slices form one slice). The slices can be viewed in the x-y plane, the x-z plane, or the y-z plane.
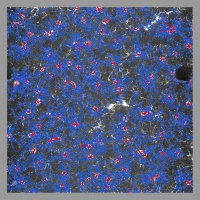
Set Projection
(2D mode) Projection view. The styles can be manipulated from the Editor Settings.
Set Raycast
(3D mode) Use the Raycast toolbar to adjust the color, brightness, and opacity of the 3D image.
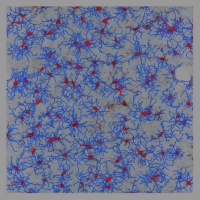
Soma Mode
Set Contour
Set Raycast
(3D mode) Use the Soma toolbar to adjust the color, brightness, and opacity of the soma.
Color By Trees
Randomly assigns a color to each trace to distinguish separate trees.
Gridlines
Show 2D/3D gridlines that can be adjusted from Editor Settings.
4 Analysis
Edit Log Information
Provides information about when the Trace Editor was started.
Show Statistics Toolbar
Show Plots
Provides a Features Plot and a Features Table for three different levels: Cell, Segment, and Node.
Cell Analysis
Provides a list of measurements using the L-measure functions.
Calculate
Convex Hull
Calculates 5 measurements based on the convex hull: magnitude, azimuth, elevation, surface area, and volume. The magnitude, azimuth, and elevation are calculated based on the overall direction of the corner points in reference to the soma point (root node). Another 3 measurements are based on the best-fit 3D ellipse: major length, minor length, and normal length.
To display the convex hull and/or ellipsoid, first run "Cell Analysis," highlight trees of interest, and then go to Visualization->Editor Settings->Display tab and click the checkbox "Convex Hull" or "Ellipsoid."
Start Active Learning
Queries user to label data points and applies label to similar data points.
Associate Nuclei to Cells
Associate nuclei table to cell feature table.
SPD Analysis
Sample progression discovery (SPD): See http://www.farsight-toolkit.org/wiki/SPD
Clusclus Analysis
A model
Editing Operations Information
Note that the functions listed above are designed to handle multiple segments at a time. The Merge function determines the closest distances between trace endpoints, distances greater than the threshold are rejected. For detailed information on the features used in computation please see Trace Editor/Features. Conflicts between two lines attempting to connect to one endpoint are resolved by finding the closest endpoints. The merge command can be invoked on a set of traces, and this function will automatically connect all the possible segments. Multiple tracelines can be organized and merged into a single linear trace.
Crossovers
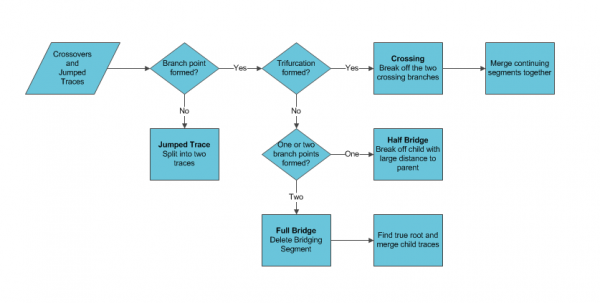
Crossovers occur when two traces become close enough to be considered connected; usually the traces are parallel or apparently intersect. If there is separation between the traces the algorithm will either jump traces or form a bridge between them. For the case where the tracer jumped between the neurons the two traces need to be split apart and might require manual tracing. If there is not enough separation between centerlines, typically in the ‘z’ axis, a trifurcation forms where one trace has three children. The artificial branch point needs to be broken and the traces merged so that the two traces continue in their original directions. If there was a bridge formed it will present as either a full or half bridge. A full bridge is two traces with a connecting trace in between creating two false branch points. A half bridge has one false branch point and a child with a large separation from the parent.
Crossovers detection can be accelerated using the features computed in the linked space to automatically highlight suspected errors. Crossings can be detected by identifying which branch points have three children. The trifurcation may also indicate false spines in a real branch point but they can be checked as the child trace would contain less than three points. A half bridge can be detected by identifying the separation distance of the child trace from the parent trace. Half bridges usually have high fragmentation of the trace and are usually leaf nodes. A Full bridge would be a continuing segment (neither root nor leaf) and have a low tracing density.
- For more information:
References
- Luisi, Jonathan; Narayanaswamy, Arunachalam; Galbreath, Zachary; Roysam, Badrinath (2011). |"The FARSIGHT Trace Editor: An Open Source Tool for 3-D Inspection and Efficient Pattern Analysis Aided Editing of Automated Neuronal Reconstructions." Neuroinformatics.
